Immigrants from Kenya vs Crow 8th Grade
COMPARE
Immigrants from Kenya
Crow
8th Grade
8th Grade Comparison
Immigrants from Kenya
Crow
95.8%
8TH GRADE
67.2/ 100
METRIC RATING
162nd/ 347
METRIC RANK
99.0%
8TH GRADE
100.0/ 100
METRIC RATING
1st/ 347
METRIC RANK
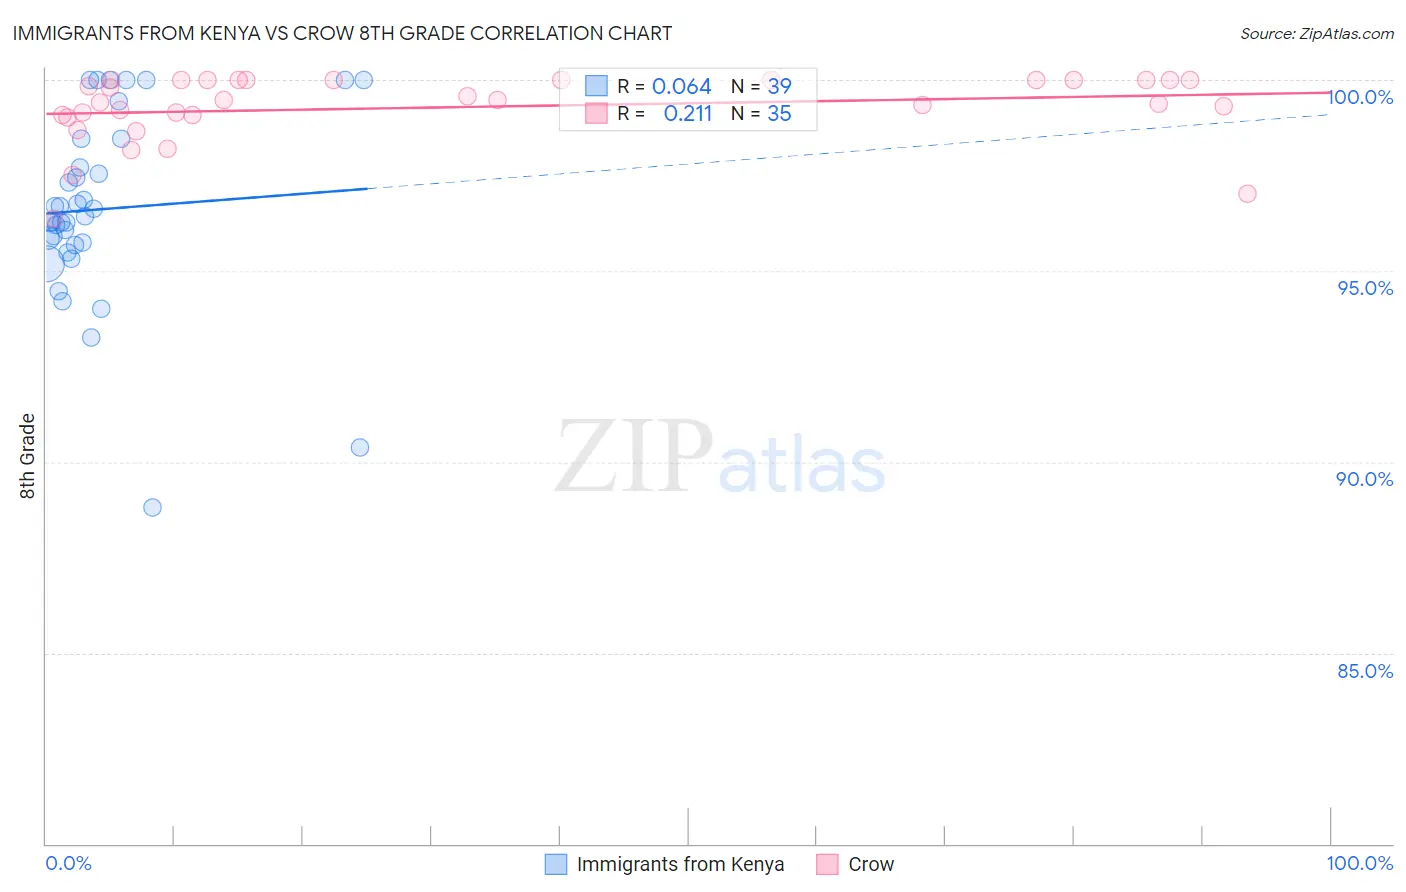
Immigrants from Kenya vs Crow 8th Grade Correlation Chart
The statistical analysis conducted on geographies consisting of 218,076,690 people shows a slight positive correlation between the proportion of Immigrants from Kenya and percentage of population with at least 8th grade education in the United States with a correlation coefficient (R) of 0.064 and weighted average of 95.8%. Similarly, the statistical analysis conducted on geographies consisting of 665,246 people shows a weak positive correlation between the proportion of Crow and percentage of population with at least 8th grade education in the United States with a correlation coefficient (R) of 0.211 and weighted average of 99.0%, a difference of 3.3%.
8th Grade Correlation Summary
| Measurement | Immigrants from Kenya | Crow |
| Minimum | 88.8% | 96.4% |
| Maximum | 100.0% | 100.0% |
| Range | 11.2% | 3.6% |
| Mean | 96.6% | 99.3% |
| Median | 96.4% | 99.5% |
| Interquartile 25% (IQ1) | 95.7% | 99.1% |
| Interquartile 75% (IQ3) | 98.5% | 100.0% |
| Interquartile Range (IQR) | 2.8% | 0.92% |
| Standard Deviation (Sample) | 2.5% | 0.90% |
| Standard Deviation (Population) | 2.5% | 0.89% |
Similar Demographics by 8th Grade
Demographics Similar to Immigrants from Kenya by 8th Grade
In terms of 8th grade, the demographic groups most similar to Immigrants from Kenya are Seminole (95.8%, a difference of 0.0%), Bermudan (95.8%, a difference of 0.0%), Immigrants from Kazakhstan (95.9%, a difference of 0.010%), Arab (95.9%, a difference of 0.020%), and Immigrants from Sri Lanka (95.8%, a difference of 0.020%).
| Demographics | Rating | Rank | 8th Grade |
| Kenyans | 74.5 /100 | #155 | Good 95.9% |
| Ugandans | 74.1 /100 | #156 | Good 95.9% |
| Immigrants | Taiwan | 70.5 /100 | #157 | Good 95.9% |
| Arabs | 69.4 /100 | #158 | Good 95.9% |
| Immigrants | Kazakhstan | 68.4 /100 | #159 | Good 95.9% |
| Seminole | 67.7 /100 | #160 | Good 95.8% |
| Bermudans | 67.5 /100 | #161 | Good 95.8% |
| Immigrants | Kenya | 67.2 /100 | #162 | Good 95.8% |
| Immigrants | Sri Lanka | 64.1 /100 | #163 | Good 95.8% |
| Immigrants | Italy | 63.5 /100 | #164 | Good 95.8% |
| Alsatians | 61.4 /100 | #165 | Good 95.8% |
| Immigrants | Poland | 61.1 /100 | #166 | Good 95.8% |
| Spaniards | 60.0 /100 | #167 | Good 95.8% |
| Immigrants | Ukraine | 59.5 /100 | #168 | Average 95.8% |
| Immigrants | Iran | 58.6 /100 | #169 | Average 95.8% |
Demographics Similar to Crow by 8th Grade
In terms of 8th grade, the demographic groups most similar to Crow are Tsimshian (99.0%, a difference of 0.090%), Finnish (98.4%, a difference of 0.69%), Carpatho Rusyn (98.1%, a difference of 0.92%), Ottawa (97.9%, a difference of 1.1%), and Dutch (97.7%, a difference of 1.4%).
| Demographics | Rating | Rank | 8th Grade |
| Crow | 100.0 /100 | #1 | Exceptional 99.0% |
| Tsimshian | 100.0 /100 | #2 | Exceptional 99.0% |
| Finns | 100.0 /100 | #3 | Exceptional 98.4% |
| Carpatho Rusyns | 100.0 /100 | #4 | Exceptional 98.1% |
| Ottawa | 100.0 /100 | #5 | Exceptional 97.9% |
| Dutch | 100.0 /100 | #6 | Exceptional 97.7% |
| Norwegians | 100.0 /100 | #7 | Exceptional 97.6% |
| Slovaks | 100.0 /100 | #8 | Exceptional 97.6% |
| Germans | 100.0 /100 | #9 | Exceptional 97.5% |
| Slovenes | 100.0 /100 | #10 | Exceptional 97.5% |
| Poles | 100.0 /100 | #11 | Exceptional 97.4% |
| Swedes | 100.0 /100 | #12 | Exceptional 97.4% |
| Alaskan Athabascans | 100.0 /100 | #13 | Exceptional 97.3% |
| English | 100.0 /100 | #14 | Exceptional 97.3% |
| Pennsylvania Germans | 100.0 /100 | #15 | Exceptional 97.3% |