Immigrants from Kenya vs Chilean Median Household Income
COMPARE
Immigrants from Kenya
Chilean
Median Household Income
Median Household Income Comparison
Immigrants from Kenya
Chileans
$83,068
MEDIAN HOUSEHOLD INCOME
21.3/ 100
METRIC RATING
206th/ 347
METRIC RANK
$90,605
MEDIAN HOUSEHOLD INCOME
97.2/ 100
METRIC RATING
109th/ 347
METRIC RANK
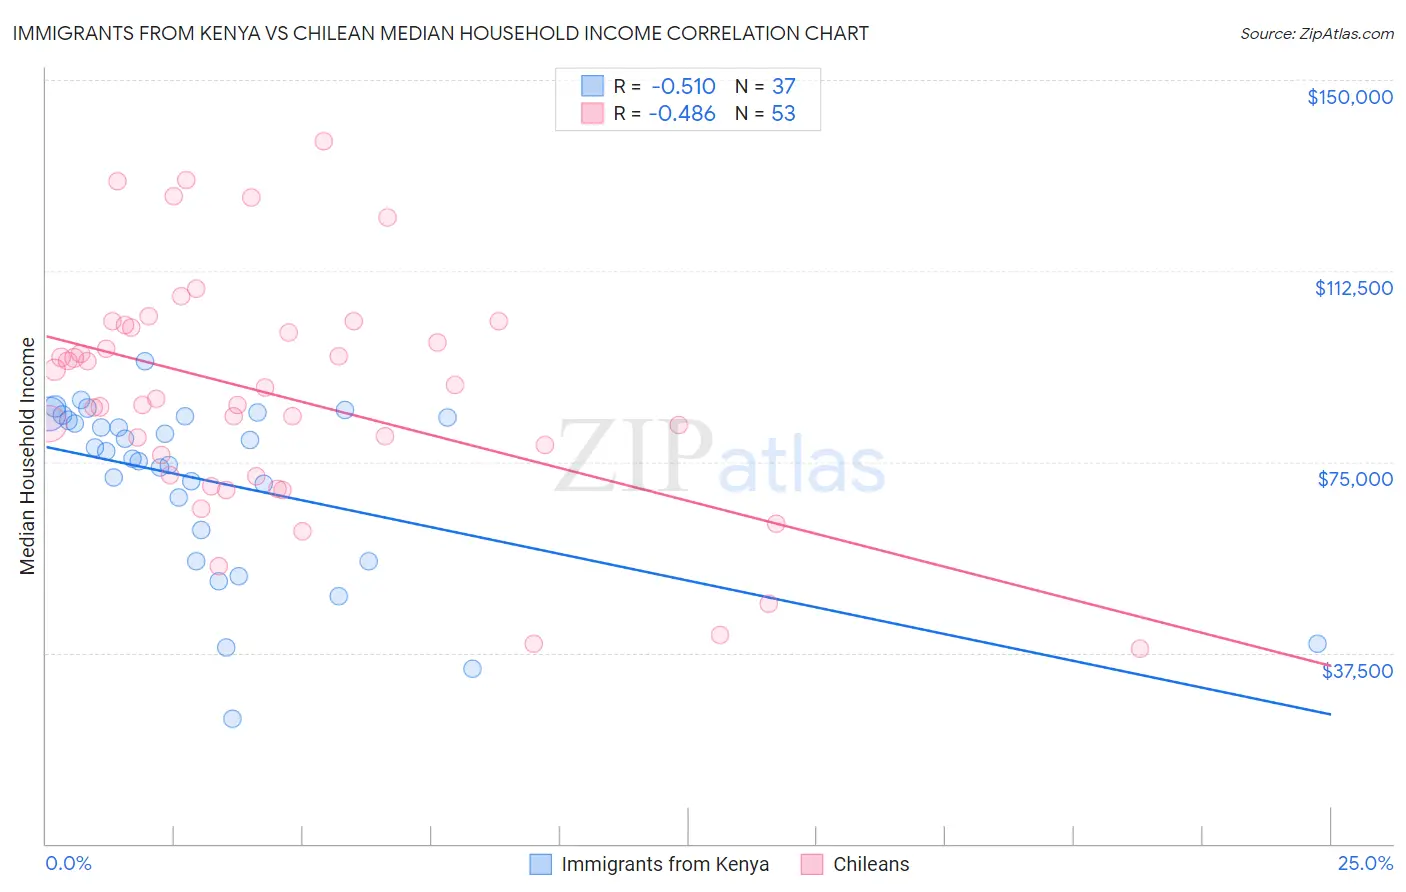
Immigrants from Kenya vs Chilean Median Household Income Correlation Chart
The statistical analysis conducted on geographies consisting of 217,959,858 people shows a substantial negative correlation between the proportion of Immigrants from Kenya and median household income in the United States with a correlation coefficient (R) of -0.510 and weighted average of $83,068. Similarly, the statistical analysis conducted on geographies consisting of 256,490,750 people shows a moderate negative correlation between the proportion of Chileans and median household income in the United States with a correlation coefficient (R) of -0.486 and weighted average of $90,605, a difference of 9.1%.
Median Household Income Correlation Summary
| Measurement | Immigrants from Kenya | Chilean |
| Minimum | $24,660 | $38,281 |
| Maximum | $94,729 | $138,054 |
| Range | $70,069 | $99,773 |
| Mean | $70,990 | $87,931 |
| Median | $77,036 | $87,519 |
| Interquartile 25% (IQ1) | $58,646 | $72,343 |
| Interquartile 75% (IQ3) | $83,895 | $101,615 |
| Interquartile Range (IQR) | $25,249 | $29,272 |
| Standard Deviation (Sample) | $17,137 | $22,824 |
| Standard Deviation (Population) | $16,903 | $22,607 |
Similar Demographics by Median Household Income
Demographics Similar to Immigrants from Kenya by Median Household Income
In terms of median household income, the demographic groups most similar to Immigrants from Kenya are Dutch ($82,971, a difference of 0.12%), Celtic ($83,193, a difference of 0.15%), Immigrants from Africa ($83,289, a difference of 0.27%), Immigrants from Cambodia ($83,304, a difference of 0.28%), and Immigrants from Thailand ($83,327, a difference of 0.31%).
| Demographics | Rating | Rank | Median Household Income |
| Germans | 24.6 /100 | #199 | Fair $83,358 |
| Tsimshian | 24.5 /100 | #200 | Fair $83,346 |
| Spanish | 24.4 /100 | #201 | Fair $83,343 |
| Immigrants | Thailand | 24.3 /100 | #202 | Fair $83,327 |
| Immigrants | Cambodia | 24.0 /100 | #203 | Fair $83,304 |
| Immigrants | Africa | 23.8 /100 | #204 | Fair $83,289 |
| Celtics | 22.7 /100 | #205 | Fair $83,193 |
| Immigrants | Kenya | 21.3 /100 | #206 | Fair $83,068 |
| Dutch | 20.3 /100 | #207 | Fair $82,971 |
| French Canadians | 18.7 /100 | #208 | Poor $82,810 |
| Immigrants | Iraq | 16.7 /100 | #209 | Poor $82,594 |
| Immigrants | Uruguay | 16.4 /100 | #210 | Poor $82,560 |
| Salvadorans | 15.4 /100 | #211 | Poor $82,449 |
| Venezuelans | 15.3 /100 | #212 | Poor $82,432 |
| Nepalese | 15.1 /100 | #213 | Poor $82,410 |
Demographics Similar to Chileans by Median Household Income
In terms of median household income, the demographic groups most similar to Chileans are Zimbabwean ($90,618, a difference of 0.020%), Palestinian ($90,574, a difference of 0.030%), Immigrants from Poland ($90,549, a difference of 0.060%), Croatian ($90,685, a difference of 0.090%), and Macedonian ($90,761, a difference of 0.17%).
| Demographics | Rating | Rank | Median Household Income |
| Austrians | 98.2 /100 | #102 | Exceptional $91,339 |
| Immigrants | Ukraine | 98.0 /100 | #103 | Exceptional $91,124 |
| Immigrants | Kazakhstan | 97.8 /100 | #104 | Exceptional $91,015 |
| Immigrants | Brazil | 97.7 /100 | #105 | Exceptional $90,907 |
| Macedonians | 97.4 /100 | #106 | Exceptional $90,761 |
| Croatians | 97.3 /100 | #107 | Exceptional $90,685 |
| Zimbabweans | 97.2 /100 | #108 | Exceptional $90,618 |
| Chileans | 97.2 /100 | #109 | Exceptional $90,605 |
| Palestinians | 97.1 /100 | #110 | Exceptional $90,574 |
| Immigrants | Poland | 97.1 /100 | #111 | Exceptional $90,549 |
| Northern Europeans | 96.9 /100 | #112 | Exceptional $90,446 |
| Peruvians | 96.5 /100 | #113 | Exceptional $90,261 |
| Immigrants | Northern Africa | 95.9 /100 | #114 | Exceptional $90,026 |
| Immigrants | Western Asia | 95.9 /100 | #115 | Exceptional $90,005 |
| Native Hawaiians | 95.7 /100 | #116 | Exceptional $89,919 |