Immigrants from Egypt vs Immigrants from Uganda Householder Income Ages 25 - 44 years
COMPARE
Immigrants from Egypt
Immigrants from Uganda
Householder Income Ages 25 - 44 years
Householder Income Ages 25 - 44 years Comparison
Immigrants from Egypt
Immigrants from Uganda
$103,192
HOUSEHOLDER INCOME AGES 25 - 44 YEARS
99.2/ 100
METRIC RATING
80th/ 347
METRIC RANK
$95,698
HOUSEHOLDER INCOME AGES 25 - 44 YEARS
65.2/ 100
METRIC RATING
157th/ 347
METRIC RANK
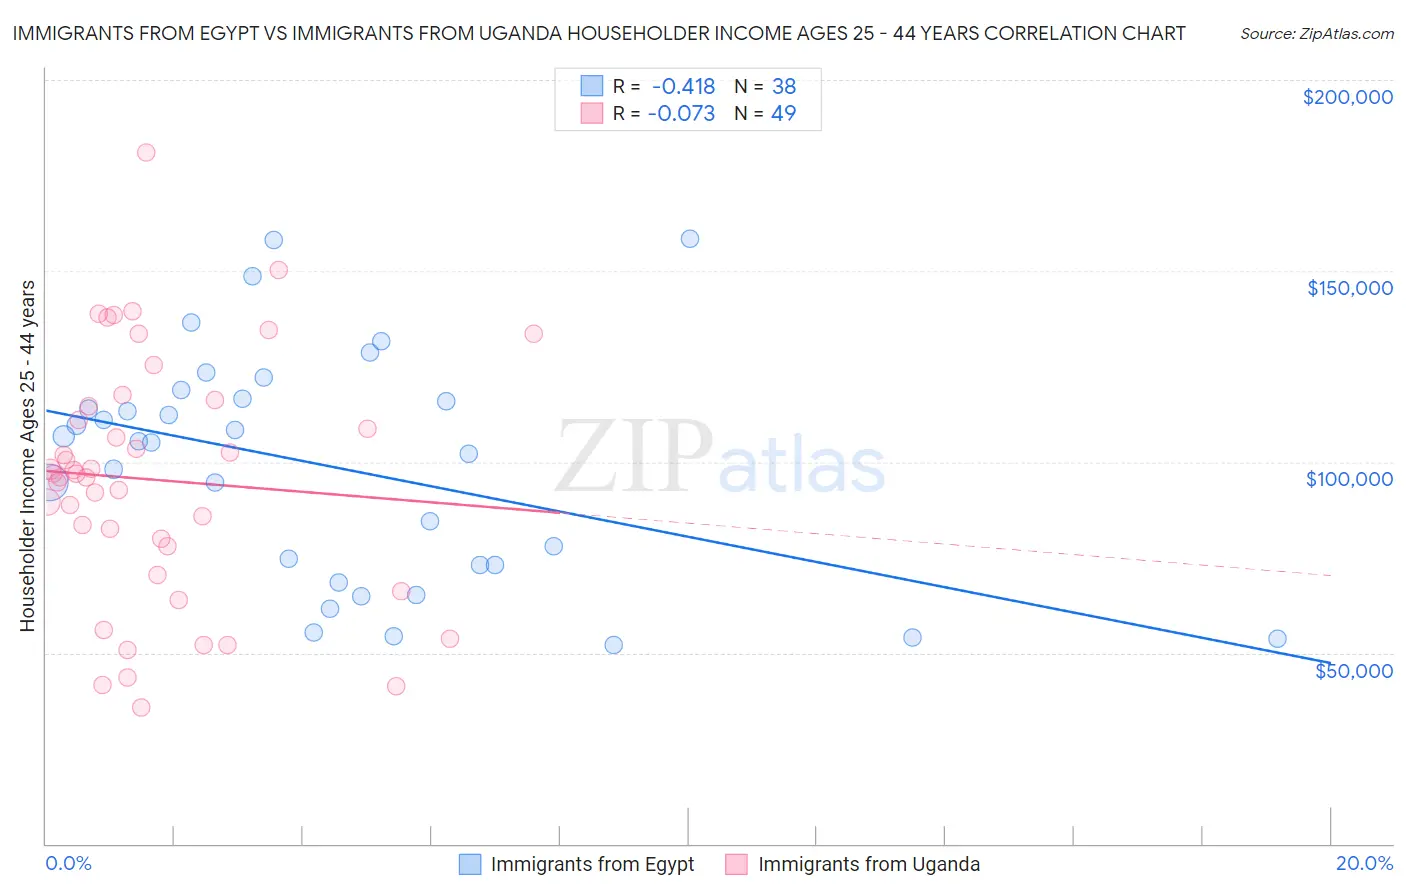
Immigrants from Egypt vs Immigrants from Uganda Householder Income Ages 25 - 44 years Correlation Chart
The statistical analysis conducted on geographies consisting of 245,137,860 people shows a moderate negative correlation between the proportion of Immigrants from Egypt and household income with householder between the ages 25 and 44 in the United States with a correlation coefficient (R) of -0.418 and weighted average of $103,192. Similarly, the statistical analysis conducted on geographies consisting of 125,922,646 people shows a slight negative correlation between the proportion of Immigrants from Uganda and household income with householder between the ages 25 and 44 in the United States with a correlation coefficient (R) of -0.073 and weighted average of $95,698, a difference of 7.8%.
Householder Income Ages 25 - 44 years Correlation Summary
| Measurement | Immigrants from Egypt | Immigrants from Uganda |
| Minimum | $52,083 | $35,667 |
| Maximum | $158,487 | $180,909 |
| Range | $106,404 | $145,242 |
| Mean | $98,589 | $95,288 |
| Median | $105,246 | $96,887 |
| Interquartile 25% (IQ1) | $73,125 | $74,128 |
| Interquartile 75% (IQ3) | $116,638 | $115,286 |
| Interquartile Range (IQR) | $43,513 | $41,158 |
| Standard Deviation (Sample) | $30,067 | $32,223 |
| Standard Deviation (Population) | $29,669 | $31,892 |
Similar Demographics by Householder Income Ages 25 - 44 years
Demographics Similar to Immigrants from Egypt by Householder Income Ages 25 - 44 years
In terms of householder income ages 25 - 44 years, the demographic groups most similar to Immigrants from Egypt are South African ($103,160, a difference of 0.030%), Immigrants from Serbia ($103,155, a difference of 0.040%), Armenian ($103,248, a difference of 0.050%), Argentinean ($103,111, a difference of 0.080%), and Immigrants from Bulgaria ($103,423, a difference of 0.22%).
| Demographics | Rating | Rank | Householder Income Ages 25 - 44 years |
| Italians | 99.5 /100 | #73 | Exceptional $104,215 |
| Immigrants | Fiji | 99.5 /100 | #74 | Exceptional $103,954 |
| Koreans | 99.4 /100 | #75 | Exceptional $103,824 |
| Immigrants | Spain | 99.4 /100 | #76 | Exceptional $103,752 |
| Immigrants | Southern Europe | 99.3 /100 | #77 | Exceptional $103,486 |
| Immigrants | Bulgaria | 99.3 /100 | #78 | Exceptional $103,423 |
| Armenians | 99.2 /100 | #79 | Exceptional $103,248 |
| Immigrants | Egypt | 99.2 /100 | #80 | Exceptional $103,192 |
| South Africans | 99.2 /100 | #81 | Exceptional $103,160 |
| Immigrants | Serbia | 99.2 /100 | #82 | Exceptional $103,155 |
| Argentineans | 99.1 /100 | #83 | Exceptional $103,111 |
| Immigrants | Philippines | 99.0 /100 | #84 | Exceptional $102,910 |
| Immigrants | Ukraine | 98.9 /100 | #85 | Exceptional $102,664 |
| Immigrants | Hungary | 98.9 /100 | #86 | Exceptional $102,655 |
| Immigrants | Western Europe | 98.9 /100 | #87 | Exceptional $102,654 |
Demographics Similar to Immigrants from Uganda by Householder Income Ages 25 - 44 years
In terms of householder income ages 25 - 44 years, the demographic groups most similar to Immigrants from Uganda are Scandinavian ($95,596, a difference of 0.11%), Costa Rican ($95,565, a difference of 0.14%), Icelander ($95,560, a difference of 0.14%), Immigrants from Portugal ($95,512, a difference of 0.19%), and Swiss ($95,511, a difference of 0.20%).
| Demographics | Rating | Rank | Householder Income Ages 25 - 44 years |
| Ugandans | 76.2 /100 | #150 | Good $96,667 |
| Czechs | 74.8 /100 | #151 | Good $96,525 |
| South American Indians | 74.5 /100 | #152 | Good $96,497 |
| Slovenes | 73.9 /100 | #153 | Good $96,439 |
| Slavs | 73.2 /100 | #154 | Good $96,377 |
| Moroccans | 70.3 /100 | #155 | Good $96,117 |
| Immigrants | Germany | 67.9 /100 | #156 | Good $95,913 |
| Immigrants | Uganda | 65.2 /100 | #157 | Good $95,698 |
| Scandinavians | 63.9 /100 | #158 | Good $95,596 |
| Costa Ricans | 63.5 /100 | #159 | Good $95,565 |
| Icelanders | 63.4 /100 | #160 | Good $95,560 |
| Immigrants | Portugal | 62.8 /100 | #161 | Good $95,512 |
| Swiss | 62.8 /100 | #162 | Good $95,511 |
| Immigrants | Saudi Arabia | 62.0 /100 | #163 | Good $95,450 |
| South Americans | 60.9 /100 | #164 | Good $95,362 |