Ugandan vs Mexican American Indian Householder Income Over 65 years
COMPARE
Ugandan
Mexican American Indian
Householder Income Over 65 years
Householder Income Over 65 years Comparison
Ugandans
Mexican American Indians
$61,177
HOUSEHOLDER INCOME OVER 65 YEARS
55.5/ 100
METRIC RATING
163rd/ 347
METRIC RANK
$56,089
HOUSEHOLDER INCOME OVER 65 YEARS
0.6/ 100
METRIC RATING
249th/ 347
METRIC RANK
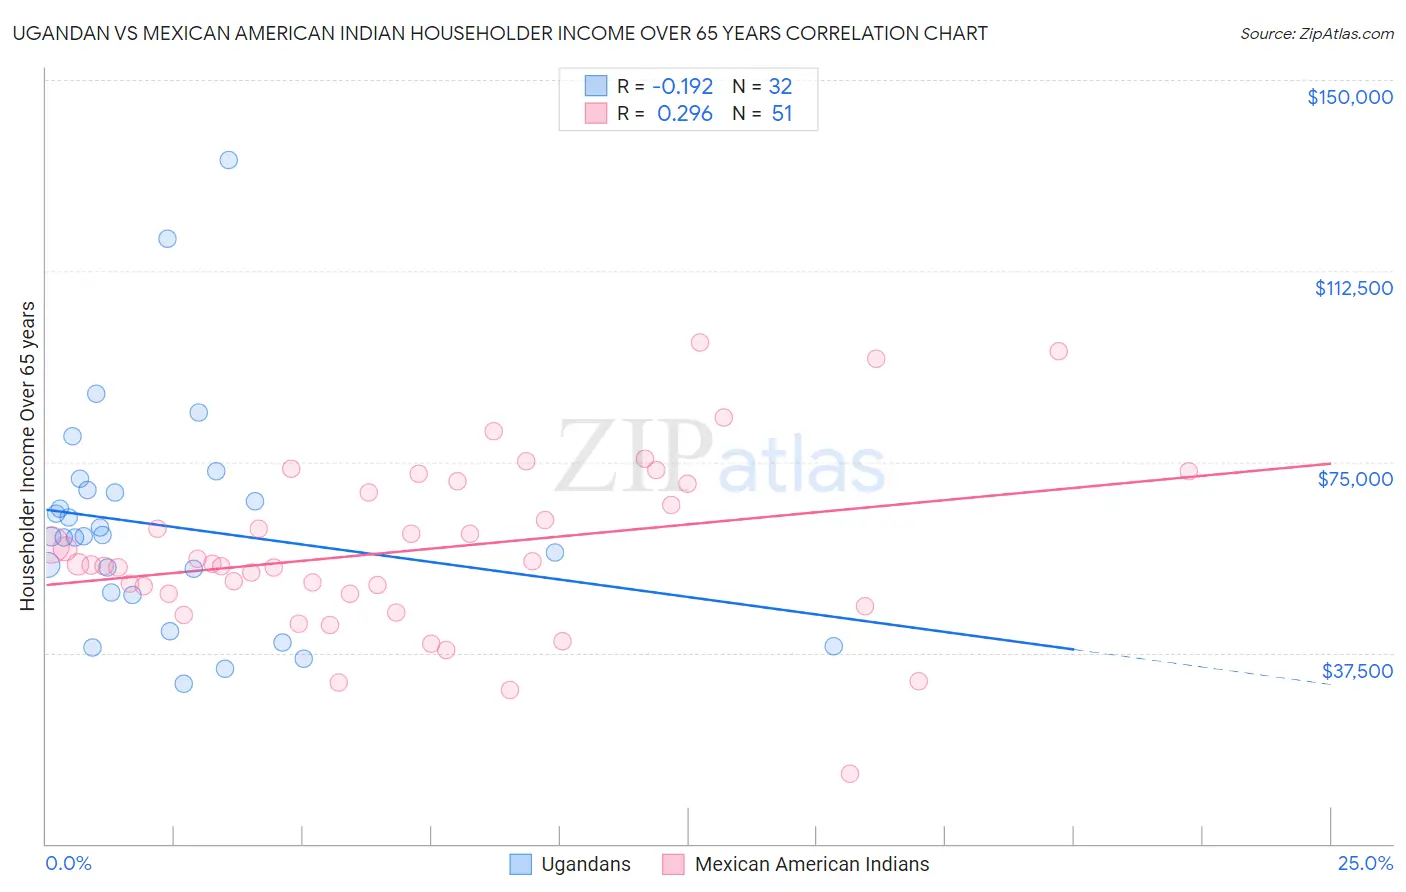
Ugandan vs Mexican American Indian Householder Income Over 65 years Correlation Chart
The statistical analysis conducted on geographies consisting of 93,951,577 people shows a poor negative correlation between the proportion of Ugandans and household income with householder over the age of 65 in the United States with a correlation coefficient (R) of -0.192 and weighted average of $61,177. Similarly, the statistical analysis conducted on geographies consisting of 316,694,324 people shows a weak positive correlation between the proportion of Mexican American Indians and household income with householder over the age of 65 in the United States with a correlation coefficient (R) of 0.296 and weighted average of $56,089, a difference of 9.1%.
Householder Income Over 65 years Correlation Summary
| Measurement | Ugandan | Mexican American Indian |
| Minimum | $31,513 | $13,750 |
| Maximum | $134,340 | $98,333 |
| Range | $102,827 | $84,583 |
| Mean | $62,320 | $57,833 |
| Median | $60,326 | $54,877 |
| Interquartile 25% (IQ1) | $49,062 | $48,998 |
| Interquartile 75% (IQ3) | $69,172 | $70,643 |
| Interquartile Range (IQR) | $20,109 | $21,645 |
| Standard Deviation (Sample) | $22,191 | $16,994 |
| Standard Deviation (Population) | $21,841 | $16,827 |
Similar Demographics by Householder Income Over 65 years
Demographics Similar to Ugandans by Householder Income Over 65 years
In terms of householder income over 65 years, the demographic groups most similar to Ugandans are Immigrants from North Macedonia ($61,175, a difference of 0.0%), Immigrants from Ukraine ($61,163, a difference of 0.020%), Immigrants from Eastern Africa ($61,157, a difference of 0.030%), Czech ($61,244, a difference of 0.11%), and Norwegian ($61,104, a difference of 0.12%).
| Demographics | Rating | Rank | Householder Income Over 65 years |
| Scandinavians | 65.6 /100 | #156 | Good $61,586 |
| Macedonians | 65.1 /100 | #157 | Good $61,564 |
| English | 63.3 /100 | #158 | Good $61,487 |
| Brazilians | 62.7 /100 | #159 | Good $61,465 |
| Portuguese | 62.1 /100 | #160 | Good $61,440 |
| Icelanders | 57.9 /100 | #161 | Average $61,270 |
| Czechs | 57.2 /100 | #162 | Average $61,244 |
| Ugandans | 55.5 /100 | #163 | Average $61,177 |
| Immigrants | North Macedonia | 55.4 /100 | #164 | Average $61,175 |
| Immigrants | Ukraine | 55.1 /100 | #165 | Average $61,163 |
| Immigrants | Eastern Africa | 55.0 /100 | #166 | Average $61,157 |
| Norwegians | 53.6 /100 | #167 | Average $61,104 |
| Irish | 53.4 /100 | #168 | Average $61,097 |
| Carpatho Rusyns | 53.3 /100 | #169 | Average $61,093 |
| Serbians | 53.1 /100 | #170 | Average $61,087 |
Demographics Similar to Mexican American Indians by Householder Income Over 65 years
In terms of householder income over 65 years, the demographic groups most similar to Mexican American Indians are Vietnamese ($56,143, a difference of 0.10%), Immigrants from Bosnia and Herzegovina ($55,986, a difference of 0.19%), Yakama ($56,234, a difference of 0.26%), Immigrants from Portugal ($55,924, a difference of 0.30%), and Central American ($56,321, a difference of 0.41%).
| Demographics | Rating | Rank | Householder Income Over 65 years |
| Yaqui | 0.8 /100 | #242 | Tragic $56,417 |
| Guyanese | 0.8 /100 | #243 | Tragic $56,351 |
| Hmong | 0.8 /100 | #244 | Tragic $56,339 |
| Immigrants | Uzbekistan | 0.8 /100 | #245 | Tragic $56,331 |
| Central Americans | 0.8 /100 | #246 | Tragic $56,321 |
| Yakama | 0.7 /100 | #247 | Tragic $56,234 |
| Vietnamese | 0.6 /100 | #248 | Tragic $56,143 |
| Mexican American Indians | 0.6 /100 | #249 | Tragic $56,089 |
| Immigrants | Bosnia and Herzegovina | 0.5 /100 | #250 | Tragic $55,986 |
| Immigrants | Portugal | 0.5 /100 | #251 | Tragic $55,924 |
| Osage | 0.4 /100 | #252 | Tragic $55,677 |
| Immigrants | Trinidad and Tobago | 0.4 /100 | #253 | Tragic $55,598 |
| Americans | 0.3 /100 | #254 | Tragic $55,527 |
| Immigrants | Bangladesh | 0.3 /100 | #255 | Tragic $55,394 |
| German Russians | 0.3 /100 | #256 | Tragic $55,356 |