Immigrants from Italy vs Irish Currently Married
COMPARE
Immigrants from Italy
Irish
Currently Married
Currently Married Comparison
Immigrants from Italy
Irish
47.7%
CURRENTLY MARRIED
92.9/ 100
METRIC RATING
107th/ 347
METRIC RANK
48.9%
CURRENTLY MARRIED
99.5/ 100
METRIC RATING
33rd/ 347
METRIC RANK
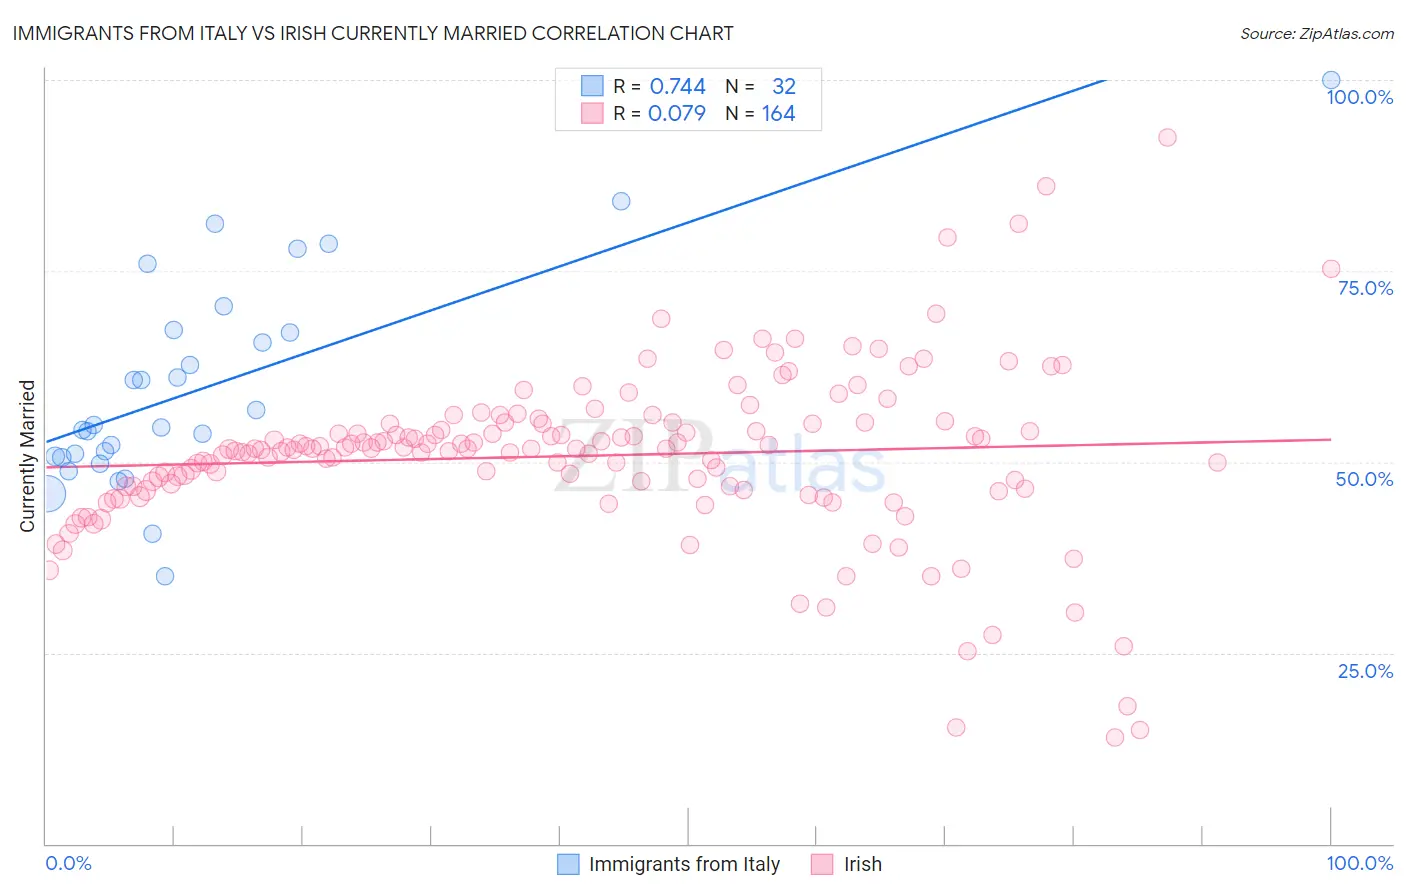
Immigrants from Italy vs Irish Currently Married Correlation Chart
The statistical analysis conducted on geographies consisting of 324,201,882 people shows a strong positive correlation between the proportion of Immigrants from Italy and percentage of population currently married in the United States with a correlation coefficient (R) of 0.744 and weighted average of 47.7%. Similarly, the statistical analysis conducted on geographies consisting of 580,554,006 people shows a slight positive correlation between the proportion of Irish and percentage of population currently married in the United States with a correlation coefficient (R) of 0.079 and weighted average of 48.9%, a difference of 2.4%.
Currently Married Correlation Summary
| Measurement | Immigrants from Italy | Irish |
| Minimum | 35.0% | 13.9% |
| Maximum | 100.0% | 92.5% |
| Range | 65.0% | 78.6% |
| Mean | 59.8% | 50.8% |
| Median | 54.7% | 51.7% |
| Interquartile 25% (IQ1) | 50.7% | 46.6% |
| Interquartile 75% (IQ3) | 67.1% | 55.0% |
| Interquartile Range (IQR) | 16.4% | 8.4% |
| Standard Deviation (Sample) | 14.0% | 11.2% |
| Standard Deviation (Population) | 13.8% | 11.1% |
Similar Demographics by Currently Married
Demographics Similar to Immigrants from Italy by Currently Married
In terms of currently married, the demographic groups most similar to Immigrants from Italy are Immigrants from Greece (47.7%, a difference of 0.030%), Immigrants from Singapore (47.8%, a difference of 0.060%), Tsimshian (47.7%, a difference of 0.060%), Immigrants from Egypt (47.7%, a difference of 0.080%), and Serbian (47.8%, a difference of 0.11%).
| Demographics | Rating | Rank | Currently Married |
| Celtics | 94.2 /100 | #100 | Exceptional 47.8% |
| Immigrants | Germany | 94.1 /100 | #101 | Exceptional 47.8% |
| Turks | 93.9 /100 | #102 | Exceptional 47.8% |
| Cypriots | 93.7 /100 | #103 | Exceptional 47.8% |
| Serbians | 93.6 /100 | #104 | Exceptional 47.8% |
| Immigrants | Singapore | 93.3 /100 | #105 | Exceptional 47.8% |
| Immigrants | Greece | 93.1 /100 | #106 | Exceptional 47.7% |
| Immigrants | Italy | 92.9 /100 | #107 | Exceptional 47.7% |
| Tsimshian | 92.4 /100 | #108 | Exceptional 47.7% |
| Immigrants | Egypt | 92.3 /100 | #109 | Exceptional 47.7% |
| Immigrants | Russia | 92.0 /100 | #110 | Exceptional 47.7% |
| Immigrants | Hungary | 91.2 /100 | #111 | Exceptional 47.6% |
| Immigrants | Western Europe | 91.1 /100 | #112 | Exceptional 47.6% |
| Immigrants | Denmark | 90.9 /100 | #113 | Exceptional 47.6% |
| South Africans | 90.5 /100 | #114 | Exceptional 47.6% |
Demographics Similar to Irish by Currently Married
In terms of currently married, the demographic groups most similar to Irish are Immigrants from Hong Kong (48.9%, a difference of 0.040%), Eastern European (48.9%, a difference of 0.050%), Polish (48.9%, a difference of 0.050%), Croatian (48.9%, a difference of 0.060%), and Immigrants from Lithuania (48.8%, a difference of 0.060%).
| Demographics | Rating | Rank | Currently Married |
| Immigrants | Korea | 99.6 /100 | #26 | Exceptional 49.0% |
| Burmese | 99.6 /100 | #27 | Exceptional 48.9% |
| Welsh | 99.5 /100 | #28 | Exceptional 48.9% |
| Croatians | 99.5 /100 | #29 | Exceptional 48.9% |
| Eastern Europeans | 99.5 /100 | #30 | Exceptional 48.9% |
| Poles | 99.5 /100 | #31 | Exceptional 48.9% |
| Immigrants | Hong Kong | 99.5 /100 | #32 | Exceptional 48.9% |
| Irish | 99.5 /100 | #33 | Exceptional 48.9% |
| Immigrants | Lithuania | 99.4 /100 | #34 | Exceptional 48.8% |
| Immigrants | Northern Europe | 99.4 /100 | #35 | Exceptional 48.8% |
| Italians | 99.4 /100 | #36 | Exceptional 48.8% |
| Hungarians | 99.4 /100 | #37 | Exceptional 48.8% |
| Czechoslovakians | 99.4 /100 | #38 | Exceptional 48.8% |
| British | 99.4 /100 | #39 | Exceptional 48.8% |
| Immigrants | Canada | 99.4 /100 | #40 | Exceptional 48.8% |