Immigrants from Jamaica vs Immigrants from West Indies Householder Income Over 65 years
COMPARE
Immigrants from Jamaica
Immigrants from West Indies
Householder Income Over 65 years
Householder Income Over 65 years Comparison
Immigrants from Jamaica
Immigrants from West Indies
$54,027
HOUSEHOLDER INCOME OVER 65 YEARS
0.1/ 100
METRIC RATING
280th/ 347
METRIC RANK
$54,927
HOUSEHOLDER INCOME OVER 65 YEARS
0.2/ 100
METRIC RATING
260th/ 347
METRIC RANK
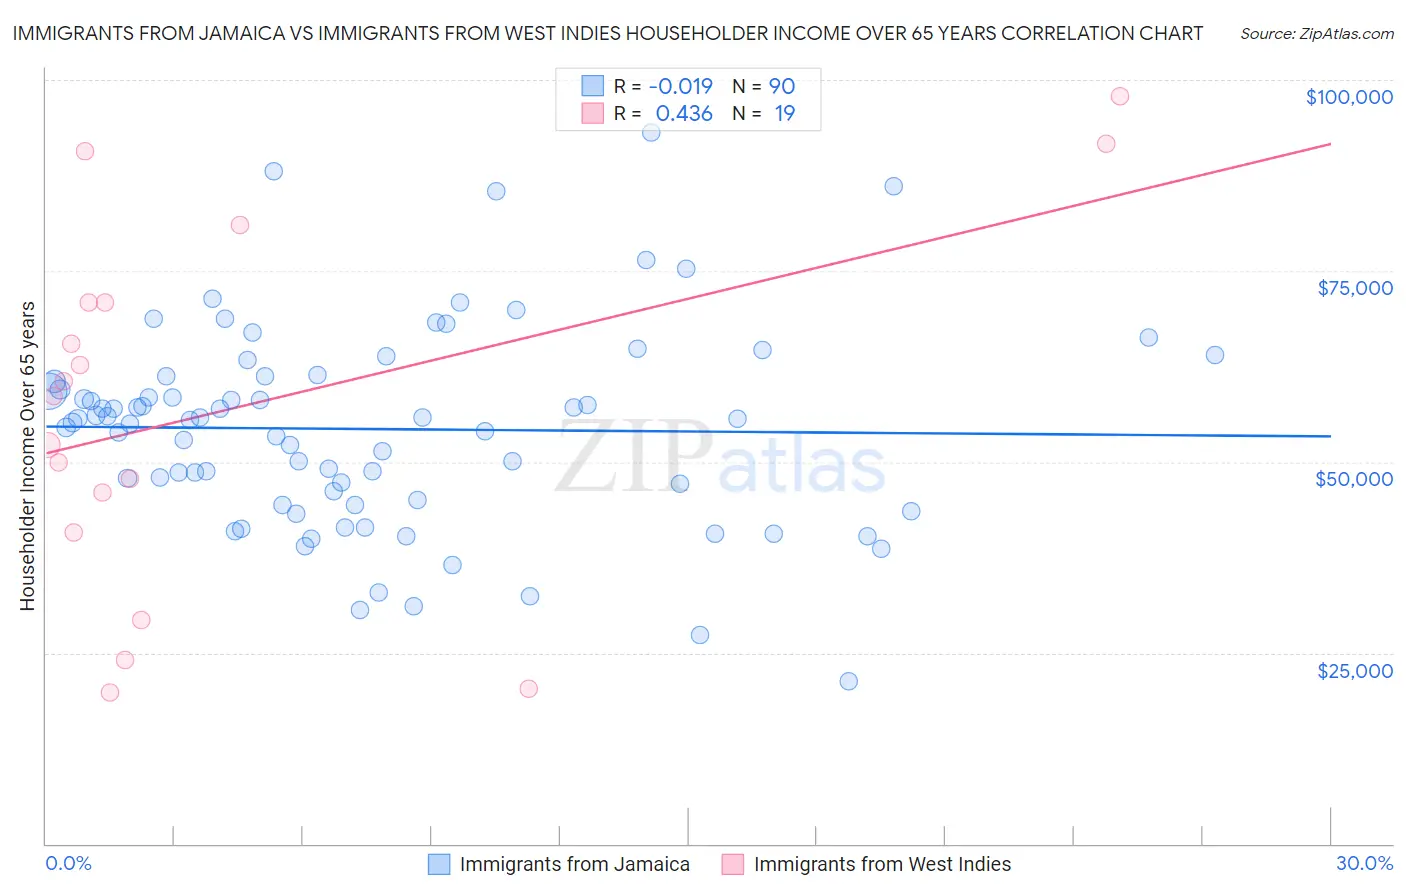
Immigrants from Jamaica vs Immigrants from West Indies Householder Income Over 65 years Correlation Chart
The statistical analysis conducted on geographies consisting of 300,610,234 people shows no correlation between the proportion of Immigrants from Jamaica and household income with householder over the age of 65 in the United States with a correlation coefficient (R) of -0.019 and weighted average of $54,027. Similarly, the statistical analysis conducted on geographies consisting of 72,436,057 people shows a moderate positive correlation between the proportion of Immigrants from West Indies and household income with householder over the age of 65 in the United States with a correlation coefficient (R) of 0.436 and weighted average of $54,927, a difference of 1.7%.
Householder Income Over 65 years Correlation Summary
| Measurement | Immigrants from Jamaica | Immigrants from West Indies |
| Minimum | $21,207 | $19,854 |
| Maximum | $93,205 | $97,868 |
| Range | $71,998 | $78,014 |
| Mean | $54,289 | $56,850 |
| Median | $55,589 | $58,586 |
| Interquartile 25% (IQ1) | $44,975 | $40,706 |
| Interquartile 75% (IQ3) | $61,216 | $70,875 |
| Interquartile Range (IQR) | $16,240 | $30,169 |
| Standard Deviation (Sample) | $13,259 | $23,837 |
| Standard Deviation (Population) | $13,185 | $23,201 |
Demographics Similar to Immigrants from Jamaica and Immigrants from West Indies by Householder Income Over 65 years
In terms of householder income over 65 years, the demographic groups most similar to Immigrants from Jamaica are Immigrants from Ecuador ($54,030, a difference of 0.0%), Blackfeet ($54,029, a difference of 0.0%), Cheyenne ($54,096, a difference of 0.13%), Cherokee ($54,133, a difference of 0.19%), and Cree ($54,129, a difference of 0.19%). Similarly, the demographic groups most similar to Immigrants from West Indies are Comanche ($54,922, a difference of 0.010%), Bangladeshi ($54,719, a difference of 0.38%), French American Indian ($54,699, a difference of 0.42%), Apache ($54,668, a difference of 0.47%), and Belizean ($54,580, a difference of 0.64%).
| Demographics | Rating | Rank | Householder Income Over 65 years |
| Immigrants | West Indies | 0.2 /100 | #260 | Tragic $54,927 |
| Comanche | 0.2 /100 | #261 | Tragic $54,922 |
| Bangladeshis | 0.1 /100 | #262 | Tragic $54,719 |
| French American Indians | 0.1 /100 | #263 | Tragic $54,699 |
| Apache | 0.1 /100 | #264 | Tragic $54,668 |
| Belizeans | 0.1 /100 | #265 | Tragic $54,580 |
| Jamaicans | 0.1 /100 | #266 | Tragic $54,560 |
| Guatemalans | 0.1 /100 | #267 | Tragic $54,526 |
| Immigrants | Zaire | 0.1 /100 | #268 | Tragic $54,512 |
| Nicaraguans | 0.1 /100 | #269 | Tragic $54,474 |
| Immigrants | Senegal | 0.1 /100 | #270 | Tragic $54,447 |
| Liberians | 0.1 /100 | #271 | Tragic $54,356 |
| Potawatomi | 0.1 /100 | #272 | Tragic $54,212 |
| Indonesians | 0.1 /100 | #273 | Tragic $54,176 |
| Barbadians | 0.1 /100 | #274 | Tragic $54,163 |
| Cherokee | 0.1 /100 | #275 | Tragic $54,133 |
| Cree | 0.1 /100 | #276 | Tragic $54,129 |
| Cheyenne | 0.1 /100 | #277 | Tragic $54,096 |
| Immigrants | Ecuador | 0.1 /100 | #278 | Tragic $54,030 |
| Blackfeet | 0.1 /100 | #279 | Tragic $54,029 |
| Immigrants | Jamaica | 0.1 /100 | #280 | Tragic $54,027 |