German Russian vs Zimbabwean Householder Income Ages 25 - 44 years
COMPARE
German Russian
Zimbabwean
Householder Income Ages 25 - 44 years
Householder Income Ages 25 - 44 years Comparison
German Russians
Zimbabweans
$85,220
HOUSEHOLDER INCOME AGES 25 - 44 YEARS
0.6/ 100
METRIC RATING
255th/ 347
METRIC RANK
$98,586
HOUSEHOLDER INCOME AGES 25 - 44 YEARS
90.3/ 100
METRIC RATING
124th/ 347
METRIC RANK
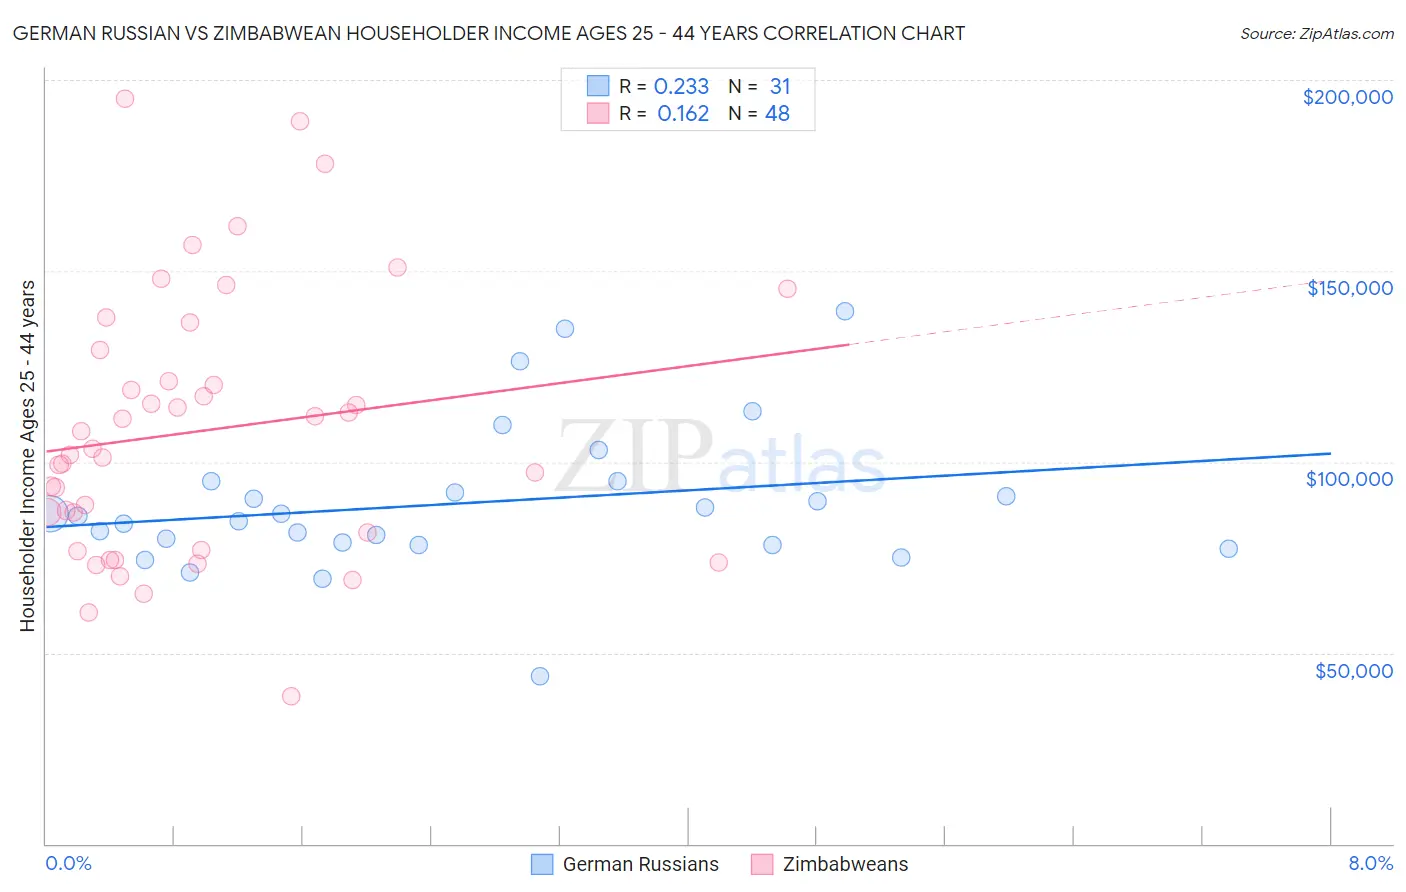
German Russian vs Zimbabwean Householder Income Ages 25 - 44 years Correlation Chart
The statistical analysis conducted on geographies consisting of 96,370,550 people shows a weak positive correlation between the proportion of German Russians and household income with householder between the ages 25 and 44 in the United States with a correlation coefficient (R) of 0.233 and weighted average of $85,220. Similarly, the statistical analysis conducted on geographies consisting of 69,182,537 people shows a poor positive correlation between the proportion of Zimbabweans and household income with householder between the ages 25 and 44 in the United States with a correlation coefficient (R) of 0.162 and weighted average of $98,586, a difference of 15.7%.
Householder Income Ages 25 - 44 years Correlation Summary
| Measurement | German Russian | Zimbabwean |
| Minimum | $43,750 | $38,611 |
| Maximum | $139,479 | $194,972 |
| Range | $95,729 | $156,361 |
| Mean | $89,217 | $108,063 |
| Median | $85,878 | $102,697 |
| Interquartile 25% (IQ1) | $78,393 | $79,354 |
| Interquartile 75% (IQ3) | $94,895 | $125,334 |
| Interquartile Range (IQR) | $16,502 | $45,980 |
| Standard Deviation (Sample) | $19,398 | $34,623 |
| Standard Deviation (Population) | $19,082 | $34,261 |
Similar Demographics by Householder Income Ages 25 - 44 years
Demographics Similar to German Russians by Householder Income Ages 25 - 44 years
In terms of householder income ages 25 - 44 years, the demographic groups most similar to German Russians are Central American ($85,144, a difference of 0.090%), Mexican American Indian ($85,066, a difference of 0.18%), Immigrants from Nicaragua ($84,914, a difference of 0.36%), Immigrants from Laos ($85,553, a difference of 0.39%), and British West Indian ($85,565, a difference of 0.40%).
| Demographics | Rating | Rank | Householder Income Ages 25 - 44 years |
| Immigrants | Sudan | 0.9 /100 | #248 | Tragic $86,109 |
| French American Indians | 0.8 /100 | #249 | Tragic $85,899 |
| Pennsylvania Germans | 0.8 /100 | #250 | Tragic $85,836 |
| Cape Verdeans | 0.8 /100 | #251 | Tragic $85,758 |
| Immigrants | Western Africa | 0.7 /100 | #252 | Tragic $85,676 |
| British West Indians | 0.7 /100 | #253 | Tragic $85,565 |
| Immigrants | Laos | 0.7 /100 | #254 | Tragic $85,553 |
| German Russians | 0.6 /100 | #255 | Tragic $85,220 |
| Central Americans | 0.5 /100 | #256 | Tragic $85,144 |
| Mexican American Indians | 0.5 /100 | #257 | Tragic $85,066 |
| Immigrants | Nicaragua | 0.5 /100 | #258 | Tragic $84,914 |
| Immigrants | Senegal | 0.5 /100 | #259 | Tragic $84,848 |
| Americans | 0.4 /100 | #260 | Tragic $84,791 |
| Inupiat | 0.4 /100 | #261 | Tragic $84,619 |
| Cree | 0.4 /100 | #262 | Tragic $84,574 |
Demographics Similar to Zimbabweans by Householder Income Ages 25 - 44 years
In terms of householder income ages 25 - 44 years, the demographic groups most similar to Zimbabweans are Palestinian ($98,777, a difference of 0.19%), Pakistani ($98,401, a difference of 0.19%), British ($98,359, a difference of 0.23%), Immigrants from Uzbekistan ($98,849, a difference of 0.27%), and Serbian ($98,320, a difference of 0.27%).
| Demographics | Rating | Rank | Householder Income Ages 25 - 44 years |
| Immigrants | Northern Africa | 93.0 /100 | #117 | Exceptional $99,232 |
| Syrians | 92.9 /100 | #118 | Exceptional $99,215 |
| Jordanians | 92.8 /100 | #119 | Exceptional $99,186 |
| Swedes | 92.7 /100 | #120 | Exceptional $99,136 |
| Peruvians | 91.7 /100 | #121 | Exceptional $98,886 |
| Immigrants | Uzbekistan | 91.5 /100 | #122 | Exceptional $98,849 |
| Palestinians | 91.2 /100 | #123 | Exceptional $98,777 |
| Zimbabweans | 90.3 /100 | #124 | Exceptional $98,586 |
| Pakistanis | 89.3 /100 | #125 | Excellent $98,401 |
| British | 89.1 /100 | #126 | Excellent $98,359 |
| Serbians | 88.9 /100 | #127 | Excellent $98,320 |
| Europeans | 88.9 /100 | #128 | Excellent $98,310 |
| Brazilians | 88.6 /100 | #129 | Excellent $98,267 |
| Immigrants | Kuwait | 87.8 /100 | #130 | Excellent $98,122 |
| Immigrants | Albania | 86.6 /100 | #131 | Excellent $97,929 |