Apache vs Sierra Leonean Householder Income Ages 25 - 44 years
COMPARE
Apache
Sierra Leonean
Householder Income Ages 25 - 44 years
Householder Income Ages 25 - 44 years Comparison
Apache
Sierra Leoneans
$80,260
HOUSEHOLDER INCOME AGES 25 - 44 YEARS
0.0/ 100
METRIC RATING
306th/ 347
METRIC RANK
$93,435
HOUSEHOLDER INCOME AGES 25 - 44 YEARS
34.8/ 100
METRIC RATING
186th/ 347
METRIC RANK
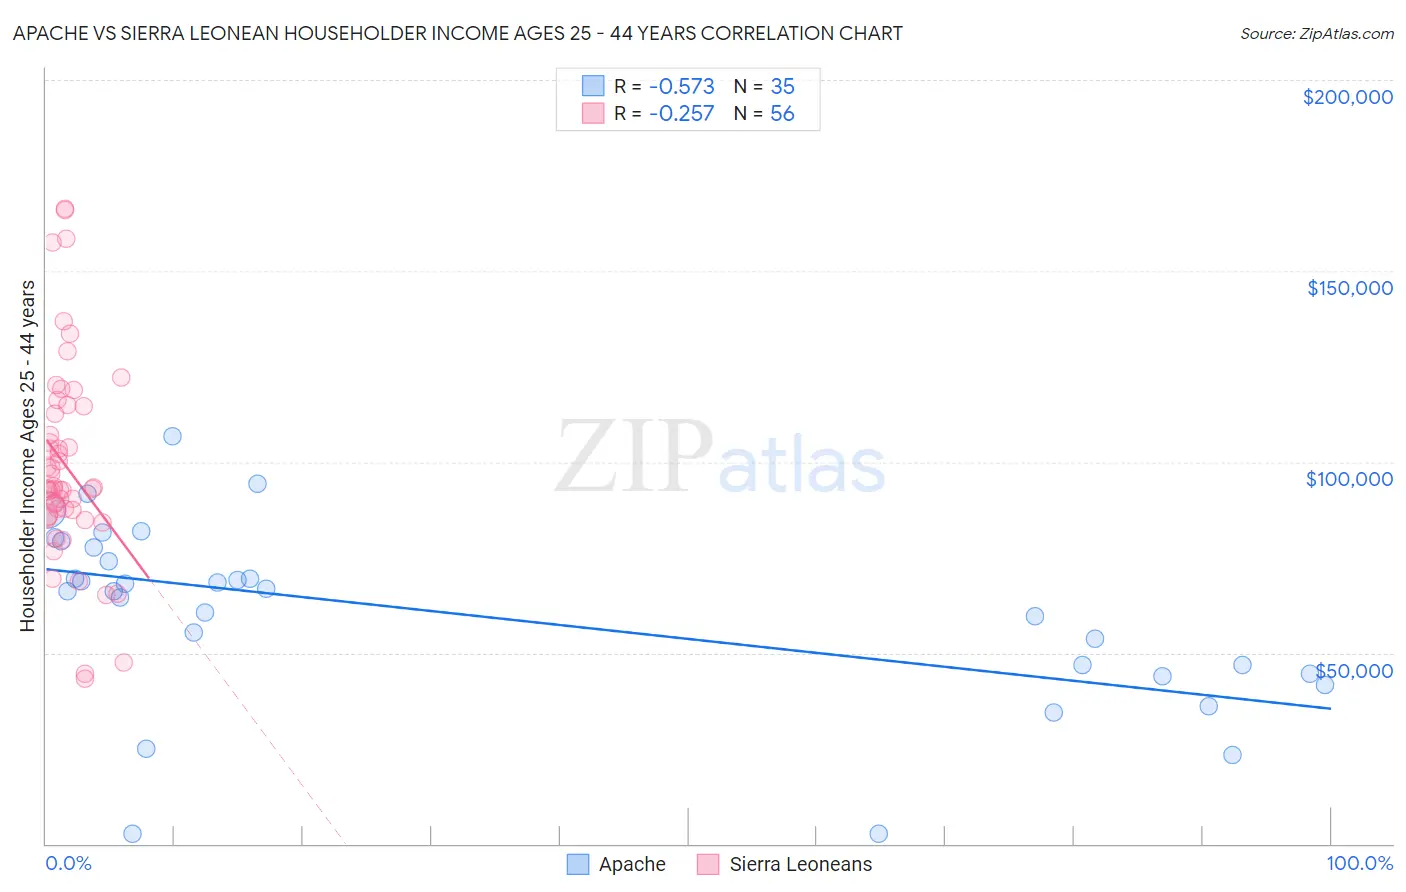
Apache vs Sierra Leonean Householder Income Ages 25 - 44 years Correlation Chart
The statistical analysis conducted on geographies consisting of 230,671,179 people shows a substantial negative correlation between the proportion of Apache and household income with householder between the ages 25 and 44 in the United States with a correlation coefficient (R) of -0.573 and weighted average of $80,260. Similarly, the statistical analysis conducted on geographies consisting of 83,314,226 people shows a weak negative correlation between the proportion of Sierra Leoneans and household income with householder between the ages 25 and 44 in the United States with a correlation coefficient (R) of -0.257 and weighted average of $93,435, a difference of 16.4%.
Householder Income Ages 25 - 44 years Correlation Summary
| Measurement | Apache | Sierra Leonean |
| Minimum | $2,499 | $43,346 |
| Maximum | $106,561 | $166,389 |
| Range | $104,062 | $123,043 |
| Mean | $60,213 | $98,723 |
| Median | $66,174 | $93,030 |
| Interquartile 25% (IQ1) | $44,643 | $85,860 |
| Interquartile 75% (IQ3) | $77,529 | $113,651 |
| Interquartile Range (IQR) | $32,886 | $27,791 |
| Standard Deviation (Sample) | $24,023 | $26,448 |
| Standard Deviation (Population) | $23,677 | $26,211 |
Similar Demographics by Householder Income Ages 25 - 44 years
Demographics Similar to Apache by Householder Income Ages 25 - 44 years
In terms of householder income ages 25 - 44 years, the demographic groups most similar to Apache are Immigrants from Dominican Republic ($80,319, a difference of 0.070%), Immigrants from Caribbean ($80,326, a difference of 0.080%), Mexican ($80,427, a difference of 0.21%), Haitian ($80,055, a difference of 0.26%), and Immigrants from Central America ($80,012, a difference of 0.31%).
| Demographics | Rating | Rank | Householder Income Ages 25 - 44 years |
| Immigrants | Liberia | 0.1 /100 | #299 | Tragic $80,863 |
| Cherokee | 0.0 /100 | #300 | Tragic $80,843 |
| Immigrants | Micronesia | 0.0 /100 | #301 | Tragic $80,544 |
| Hispanics or Latinos | 0.0 /100 | #302 | Tragic $80,515 |
| Mexicans | 0.0 /100 | #303 | Tragic $80,427 |
| Immigrants | Caribbean | 0.0 /100 | #304 | Tragic $80,326 |
| Immigrants | Dominican Republic | 0.0 /100 | #305 | Tragic $80,319 |
| Apache | 0.0 /100 | #306 | Tragic $80,260 |
| Haitians | 0.0 /100 | #307 | Tragic $80,055 |
| Immigrants | Central America | 0.0 /100 | #308 | Tragic $80,012 |
| Chippewa | 0.0 /100 | #309 | Tragic $80,005 |
| Fijians | 0.0 /100 | #310 | Tragic $79,956 |
| Indonesians | 0.0 /100 | #311 | Tragic $79,543 |
| Immigrants | Haiti | 0.0 /100 | #312 | Tragic $79,391 |
| Menominee | 0.0 /100 | #313 | Tragic $79,358 |
Demographics Similar to Sierra Leoneans by Householder Income Ages 25 - 44 years
In terms of householder income ages 25 - 44 years, the demographic groups most similar to Sierra Leoneans are Immigrants from Eritrea ($93,466, a difference of 0.030%), Spaniard ($93,366, a difference of 0.070%), German ($93,531, a difference of 0.10%), Guamanian/Chamorro ($93,569, a difference of 0.14%), and Uruguayan ($93,631, a difference of 0.21%).
| Demographics | Rating | Rank | Householder Income Ages 25 - 44 years |
| French Canadians | 38.2 /100 | #179 | Fair $93,694 |
| French | 37.8 /100 | #180 | Fair $93,665 |
| Puget Sound Salish | 37.7 /100 | #181 | Fair $93,661 |
| Uruguayans | 37.3 /100 | #182 | Fair $93,631 |
| Guamanians/Chamorros | 36.5 /100 | #183 | Fair $93,569 |
| Germans | 36.0 /100 | #184 | Fair $93,531 |
| Immigrants | Eritrea | 35.2 /100 | #185 | Fair $93,466 |
| Sierra Leoneans | 34.8 /100 | #186 | Fair $93,435 |
| Spaniards | 34.0 /100 | #187 | Fair $93,366 |
| Immigrants | Sierra Leone | 30.9 /100 | #188 | Fair $93,115 |
| Dutch | 30.5 /100 | #189 | Fair $93,081 |
| Welsh | 30.0 /100 | #190 | Fair $93,039 |
| Tlingit-Haida | 29.4 /100 | #191 | Fair $92,987 |
| Immigrants | Costa Rica | 28.2 /100 | #192 | Fair $92,876 |
| Samoans | 23.0 /100 | #193 | Fair $92,385 |