Immigrants from Portugal vs Sierra Leonean Householder Income Ages 25 - 44 years
COMPARE
Immigrants from Portugal
Sierra Leonean
Householder Income Ages 25 - 44 years
Householder Income Ages 25 - 44 years Comparison
Immigrants from Portugal
Sierra Leoneans
$95,512
HOUSEHOLDER INCOME AGES 25 - 44 YEARS
62.8/ 100
METRIC RATING
161st/ 347
METRIC RANK
$93,435
HOUSEHOLDER INCOME AGES 25 - 44 YEARS
34.8/ 100
METRIC RATING
186th/ 347
METRIC RANK
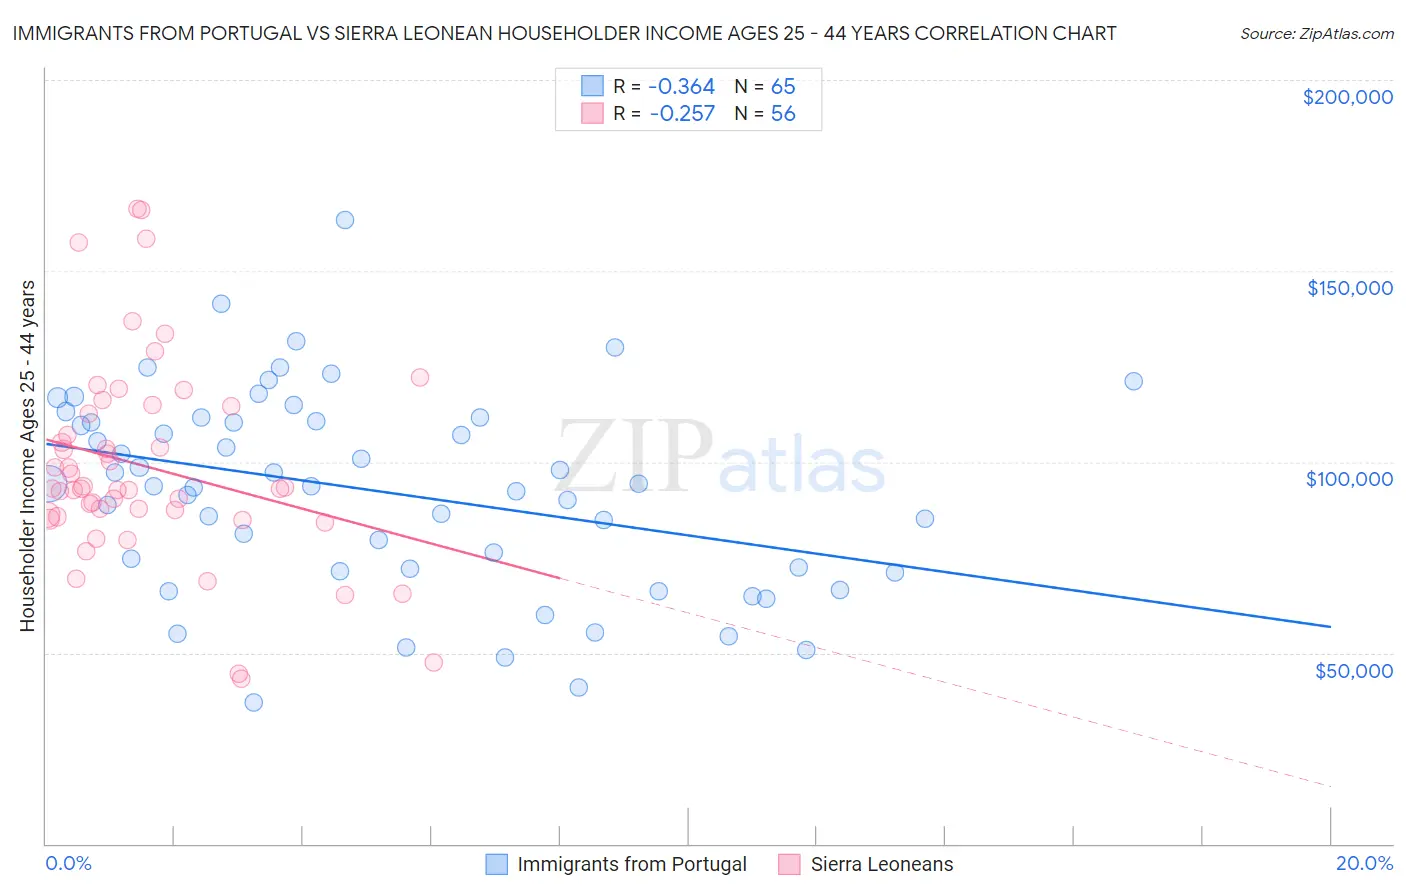
Immigrants from Portugal vs Sierra Leonean Householder Income Ages 25 - 44 years Correlation Chart
The statistical analysis conducted on geographies consisting of 174,576,361 people shows a mild negative correlation between the proportion of Immigrants from Portugal and household income with householder between the ages 25 and 44 in the United States with a correlation coefficient (R) of -0.364 and weighted average of $95,512. Similarly, the statistical analysis conducted on geographies consisting of 83,314,226 people shows a weak negative correlation between the proportion of Sierra Leoneans and household income with householder between the ages 25 and 44 in the United States with a correlation coefficient (R) of -0.257 and weighted average of $93,435, a difference of 2.2%.
Householder Income Ages 25 - 44 years Correlation Summary
| Measurement | Immigrants from Portugal | Sierra Leonean |
| Minimum | $36,913 | $43,346 |
| Maximum | $163,387 | $166,389 |
| Range | $126,474 | $123,043 |
| Mean | $92,248 | $98,723 |
| Median | $93,647 | $93,030 |
| Interquartile 25% (IQ1) | $71,683 | $85,860 |
| Interquartile 75% (IQ3) | $111,037 | $113,651 |
| Interquartile Range (IQR) | $39,354 | $27,791 |
| Standard Deviation (Sample) | $26,108 | $26,448 |
| Standard Deviation (Population) | $25,907 | $26,211 |
Similar Demographics by Householder Income Ages 25 - 44 years
Demographics Similar to Immigrants from Portugal by Householder Income Ages 25 - 44 years
In terms of householder income ages 25 - 44 years, the demographic groups most similar to Immigrants from Portugal are Swiss ($95,511, a difference of 0.0%), Icelander ($95,560, a difference of 0.050%), Costa Rican ($95,565, a difference of 0.060%), Immigrants from Saudi Arabia ($95,450, a difference of 0.070%), and Scandinavian ($95,596, a difference of 0.090%).
| Demographics | Rating | Rank | Householder Income Ages 25 - 44 years |
| Slavs | 73.2 /100 | #154 | Good $96,377 |
| Moroccans | 70.3 /100 | #155 | Good $96,117 |
| Immigrants | Germany | 67.9 /100 | #156 | Good $95,913 |
| Immigrants | Uganda | 65.2 /100 | #157 | Good $95,698 |
| Scandinavians | 63.9 /100 | #158 | Good $95,596 |
| Costa Ricans | 63.5 /100 | #159 | Good $95,565 |
| Icelanders | 63.4 /100 | #160 | Good $95,560 |
| Immigrants | Portugal | 62.8 /100 | #161 | Good $95,512 |
| Swiss | 62.8 /100 | #162 | Good $95,511 |
| Immigrants | Saudi Arabia | 62.0 /100 | #163 | Good $95,450 |
| South Americans | 60.9 /100 | #164 | Good $95,362 |
| Immigrants | Nepal | 60.3 /100 | #165 | Good $95,322 |
| Immigrants | Ethiopia | 59.5 /100 | #166 | Average $95,256 |
| Czechoslovakians | 57.0 /100 | #167 | Average $95,070 |
| Alsatians | 56.8 /100 | #168 | Average $95,059 |
Demographics Similar to Sierra Leoneans by Householder Income Ages 25 - 44 years
In terms of householder income ages 25 - 44 years, the demographic groups most similar to Sierra Leoneans are Immigrants from Eritrea ($93,466, a difference of 0.030%), Spaniard ($93,366, a difference of 0.070%), German ($93,531, a difference of 0.10%), Guamanian/Chamorro ($93,569, a difference of 0.14%), and Uruguayan ($93,631, a difference of 0.21%).
| Demographics | Rating | Rank | Householder Income Ages 25 - 44 years |
| French Canadians | 38.2 /100 | #179 | Fair $93,694 |
| French | 37.8 /100 | #180 | Fair $93,665 |
| Puget Sound Salish | 37.7 /100 | #181 | Fair $93,661 |
| Uruguayans | 37.3 /100 | #182 | Fair $93,631 |
| Guamanians/Chamorros | 36.5 /100 | #183 | Fair $93,569 |
| Germans | 36.0 /100 | #184 | Fair $93,531 |
| Immigrants | Eritrea | 35.2 /100 | #185 | Fair $93,466 |
| Sierra Leoneans | 34.8 /100 | #186 | Fair $93,435 |
| Spaniards | 34.0 /100 | #187 | Fair $93,366 |
| Immigrants | Sierra Leone | 30.9 /100 | #188 | Fair $93,115 |
| Dutch | 30.5 /100 | #189 | Fair $93,081 |
| Welsh | 30.0 /100 | #190 | Fair $93,039 |
| Tlingit-Haida | 29.4 /100 | #191 | Fair $92,987 |
| Immigrants | Costa Rica | 28.2 /100 | #192 | Fair $92,876 |
| Samoans | 23.0 /100 | #193 | Fair $92,385 |