Mongolian vs Immigrants from Bosnia and Herzegovina Median Family Income
COMPARE
Mongolian
Immigrants from Bosnia and Herzegovina
Median Family Income
Median Family Income Comparison
Mongolians
Immigrants from Bosnia and Herzegovina
$114,553
MEDIAN FAMILY INCOME
99.8/ 100
METRIC RATING
62nd/ 347
METRIC RANK
$97,432
MEDIAN FAMILY INCOME
6.4/ 100
METRIC RATING
216th/ 347
METRIC RANK
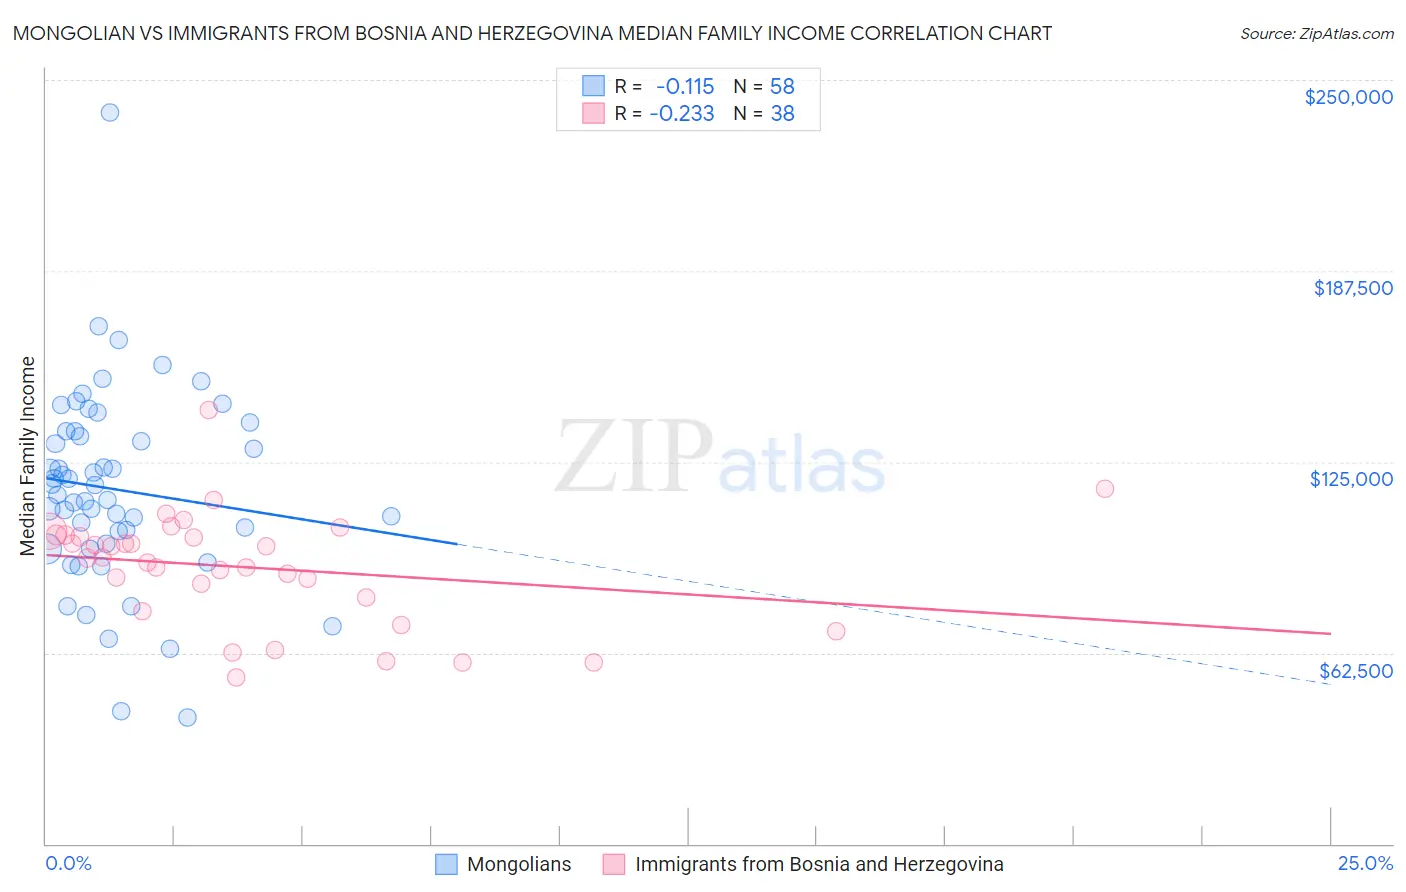
Mongolian vs Immigrants from Bosnia and Herzegovina Median Family Income Correlation Chart
The statistical analysis conducted on geographies consisting of 140,257,208 people shows a poor negative correlation between the proportion of Mongolians and median family income in the United States with a correlation coefficient (R) of -0.115 and weighted average of $114,553. Similarly, the statistical analysis conducted on geographies consisting of 156,800,946 people shows a weak negative correlation between the proportion of Immigrants from Bosnia and Herzegovina and median family income in the United States with a correlation coefficient (R) of -0.233 and weighted average of $97,432, a difference of 17.6%.
Median Family Income Correlation Summary
| Measurement | Mongolian | Immigrants from Bosnia and Herzegovina |
| Minimum | $41,389 | $54,501 |
| Maximum | $239,335 | $142,183 |
| Range | $197,946 | $87,682 |
| Mean | $115,974 | $90,450 |
| Median | $115,745 | $93,519 |
| Interquartile 25% (IQ1) | $98,398 | $80,405 |
| Interquartile 75% (IQ3) | $135,066 | $100,969 |
| Interquartile Range (IQR) | $36,668 | $20,564 |
| Standard Deviation (Sample) | $32,155 | $18,350 |
| Standard Deviation (Population) | $31,876 | $18,107 |
Similar Demographics by Median Family Income
Demographics Similar to Mongolians by Median Family Income
In terms of median family income, the demographic groups most similar to Mongolians are Immigrants from Belarus ($114,586, a difference of 0.030%), Immigrants from Pakistan ($114,406, a difference of 0.13%), Immigrants from Scotland ($114,392, a difference of 0.14%), Immigrants from Latvia ($114,826, a difference of 0.24%), and Immigrants from Netherlands ($114,987, a difference of 0.38%).
| Demographics | Rating | Rank | Median Family Income |
| Lithuanians | 99.8 /100 | #55 | Exceptional $115,395 |
| New Zealanders | 99.8 /100 | #56 | Exceptional $115,230 |
| Greeks | 99.8 /100 | #57 | Exceptional $115,192 |
| Immigrants | Indonesia | 99.8 /100 | #58 | Exceptional $115,162 |
| Immigrants | Netherlands | 99.8 /100 | #59 | Exceptional $114,987 |
| Immigrants | Latvia | 99.8 /100 | #60 | Exceptional $114,826 |
| Immigrants | Belarus | 99.8 /100 | #61 | Exceptional $114,586 |
| Mongolians | 99.8 /100 | #62 | Exceptional $114,553 |
| Immigrants | Pakistan | 99.8 /100 | #63 | Exceptional $114,406 |
| Immigrants | Scotland | 99.7 /100 | #64 | Exceptional $114,392 |
| Egyptians | 99.7 /100 | #65 | Exceptional $114,119 |
| Paraguayans | 99.7 /100 | #66 | Exceptional $114,016 |
| Immigrants | Spain | 99.7 /100 | #67 | Exceptional $113,815 |
| Immigrants | Serbia | 99.6 /100 | #68 | Exceptional $113,463 |
| Immigrants | Bulgaria | 99.6 /100 | #69 | Exceptional $113,461 |
Demographics Similar to Immigrants from Bosnia and Herzegovina by Median Family Income
In terms of median family income, the demographic groups most similar to Immigrants from Bosnia and Herzegovina are Nigerian ($97,522, a difference of 0.090%), Bermudan ($97,577, a difference of 0.15%), Japanese ($97,288, a difference of 0.15%), Immigrants from Armenia ($97,605, a difference of 0.18%), and Immigrants from Cambodia ($97,222, a difference of 0.22%).
| Demographics | Rating | Rank | Median Family Income |
| Immigrants | Colombia | 8.7 /100 | #209 | Tragic $98,067 |
| Puget Sound Salish | 8.2 /100 | #210 | Tragic $97,958 |
| Immigrants | Sudan | 7.4 /100 | #211 | Tragic $97,737 |
| Panamanians | 7.2 /100 | #212 | Tragic $97,683 |
| Immigrants | Armenia | 7.0 /100 | #213 | Tragic $97,605 |
| Bermudans | 6.9 /100 | #214 | Tragic $97,577 |
| Nigerians | 6.7 /100 | #215 | Tragic $97,522 |
| Immigrants | Bosnia and Herzegovina | 6.4 /100 | #216 | Tragic $97,432 |
| Japanese | 6.0 /100 | #217 | Tragic $97,288 |
| Immigrants | Cambodia | 5.8 /100 | #218 | Tragic $97,222 |
| Delaware | 5.1 /100 | #219 | Tragic $96,958 |
| Sudanese | 4.7 /100 | #220 | Tragic $96,783 |
| Immigrants | Ghana | 4.2 /100 | #221 | Tragic $96,544 |
| Immigrants | Nigeria | 4.0 /100 | #222 | Tragic $96,439 |
| Venezuelans | 3.7 /100 | #223 | Tragic $96,281 |