Australian vs Immigrants from Bosnia and Herzegovina Median Family Income
COMPARE
Australian
Immigrants from Bosnia and Herzegovina
Median Family Income
Median Family Income Comparison
Australians
Immigrants from Bosnia and Herzegovina
$118,440
MEDIAN FAMILY INCOME
100.0/ 100
METRIC RATING
37th/ 347
METRIC RANK
$97,432
MEDIAN FAMILY INCOME
6.4/ 100
METRIC RATING
216th/ 347
METRIC RANK
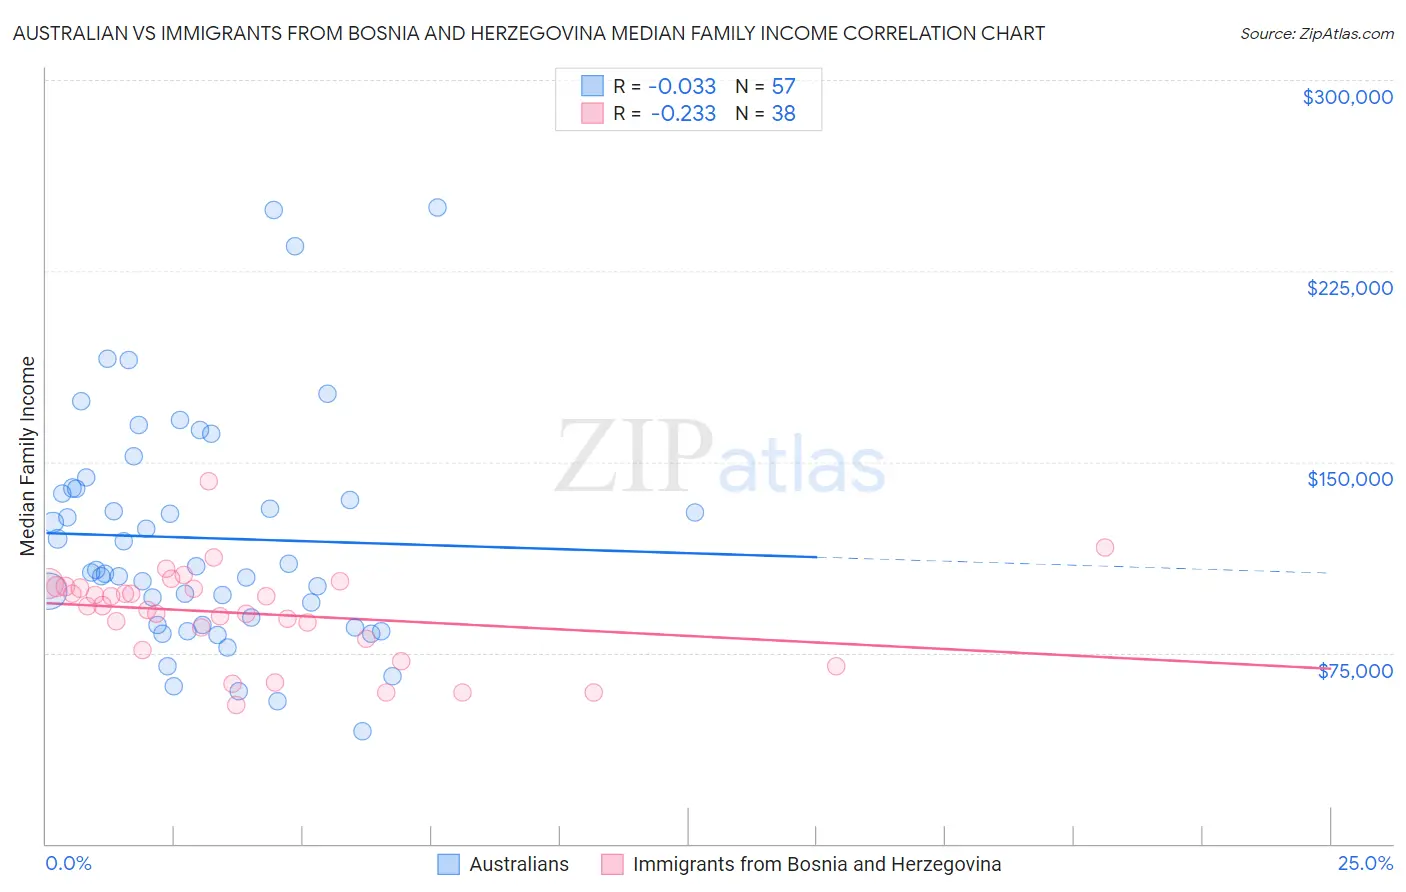
Australian vs Immigrants from Bosnia and Herzegovina Median Family Income Correlation Chart
The statistical analysis conducted on geographies consisting of 223,969,343 people shows no correlation between the proportion of Australians and median family income in the United States with a correlation coefficient (R) of -0.033 and weighted average of $118,440. Similarly, the statistical analysis conducted on geographies consisting of 156,800,946 people shows a weak negative correlation between the proportion of Immigrants from Bosnia and Herzegovina and median family income in the United States with a correlation coefficient (R) of -0.233 and weighted average of $97,432, a difference of 21.6%.
Median Family Income Correlation Summary
| Measurement | Australian | Immigrants from Bosnia and Herzegovina |
| Minimum | $44,219 | $54,501 |
| Maximum | $250,001 | $142,183 |
| Range | $205,782 | $87,682 |
| Mean | $120,063 | $90,450 |
| Median | $107,342 | $93,519 |
| Interquartile 25% (IQ1) | $85,865 | $80,405 |
| Interquartile 75% (IQ3) | $139,651 | $100,969 |
| Interquartile Range (IQR) | $53,786 | $20,564 |
| Standard Deviation (Sample) | $45,096 | $18,350 |
| Standard Deviation (Population) | $44,699 | $18,107 |
Similar Demographics by Median Family Income
Demographics Similar to Australians by Median Family Income
In terms of median family income, the demographic groups most similar to Australians are Immigrants from Turkey ($118,325, a difference of 0.10%), Israeli ($118,577, a difference of 0.12%), Immigrants from Asia ($118,291, a difference of 0.13%), Immigrants from Lithuania ($118,053, a difference of 0.33%), and Estonian ($118,013, a difference of 0.36%).
| Demographics | Rating | Rank | Median Family Income |
| Immigrants | Sri Lanka | 100.0 /100 | #30 | Exceptional $120,263 |
| Immigrants | France | 100.0 /100 | #31 | Exceptional $120,076 |
| Asians | 100.0 /100 | #32 | Exceptional $119,955 |
| Bhutanese | 100.0 /100 | #33 | Exceptional $119,800 |
| Bolivians | 100.0 /100 | #34 | Exceptional $119,479 |
| Soviet Union | 100.0 /100 | #35 | Exceptional $119,262 |
| Israelis | 100.0 /100 | #36 | Exceptional $118,577 |
| Australians | 100.0 /100 | #37 | Exceptional $118,440 |
| Immigrants | Turkey | 100.0 /100 | #38 | Exceptional $118,325 |
| Immigrants | Asia | 100.0 /100 | #39 | Exceptional $118,291 |
| Immigrants | Lithuania | 100.0 /100 | #40 | Exceptional $118,053 |
| Estonians | 100.0 /100 | #41 | Exceptional $118,013 |
| Immigrants | Bolivia | 100.0 /100 | #42 | Exceptional $117,912 |
| Bulgarians | 100.0 /100 | #43 | Exceptional $117,818 |
| Cambodians | 100.0 /100 | #44 | Exceptional $117,780 |
Demographics Similar to Immigrants from Bosnia and Herzegovina by Median Family Income
In terms of median family income, the demographic groups most similar to Immigrants from Bosnia and Herzegovina are Nigerian ($97,522, a difference of 0.090%), Bermudan ($97,577, a difference of 0.15%), Japanese ($97,288, a difference of 0.15%), Immigrants from Armenia ($97,605, a difference of 0.18%), and Immigrants from Cambodia ($97,222, a difference of 0.22%).
| Demographics | Rating | Rank | Median Family Income |
| Immigrants | Colombia | 8.7 /100 | #209 | Tragic $98,067 |
| Puget Sound Salish | 8.2 /100 | #210 | Tragic $97,958 |
| Immigrants | Sudan | 7.4 /100 | #211 | Tragic $97,737 |
| Panamanians | 7.2 /100 | #212 | Tragic $97,683 |
| Immigrants | Armenia | 7.0 /100 | #213 | Tragic $97,605 |
| Bermudans | 6.9 /100 | #214 | Tragic $97,577 |
| Nigerians | 6.7 /100 | #215 | Tragic $97,522 |
| Immigrants | Bosnia and Herzegovina | 6.4 /100 | #216 | Tragic $97,432 |
| Japanese | 6.0 /100 | #217 | Tragic $97,288 |
| Immigrants | Cambodia | 5.8 /100 | #218 | Tragic $97,222 |
| Delaware | 5.1 /100 | #219 | Tragic $96,958 |
| Sudanese | 4.7 /100 | #220 | Tragic $96,783 |
| Immigrants | Ghana | 4.2 /100 | #221 | Tragic $96,544 |
| Immigrants | Nigeria | 4.0 /100 | #222 | Tragic $96,439 |
| Venezuelans | 3.7 /100 | #223 | Tragic $96,281 |