Immigrants from Iran vs Immigrants from Costa Rica Householder Income Ages 45 - 64 years
COMPARE
Immigrants from Iran
Immigrants from Costa Rica
Householder Income Ages 45 - 64 years
Householder Income Ages 45 - 64 years Comparison
Immigrants from Iran
Immigrants from Costa Rica
$126,940
HOUSEHOLDER INCOME AGES 45 - 64 YEARS
100.0/ 100
METRIC RATING
8th/ 347
METRIC RANK
$100,141
HOUSEHOLDER INCOME AGES 45 - 64 YEARS
47.7/ 100
METRIC RATING
176th/ 347
METRIC RANK
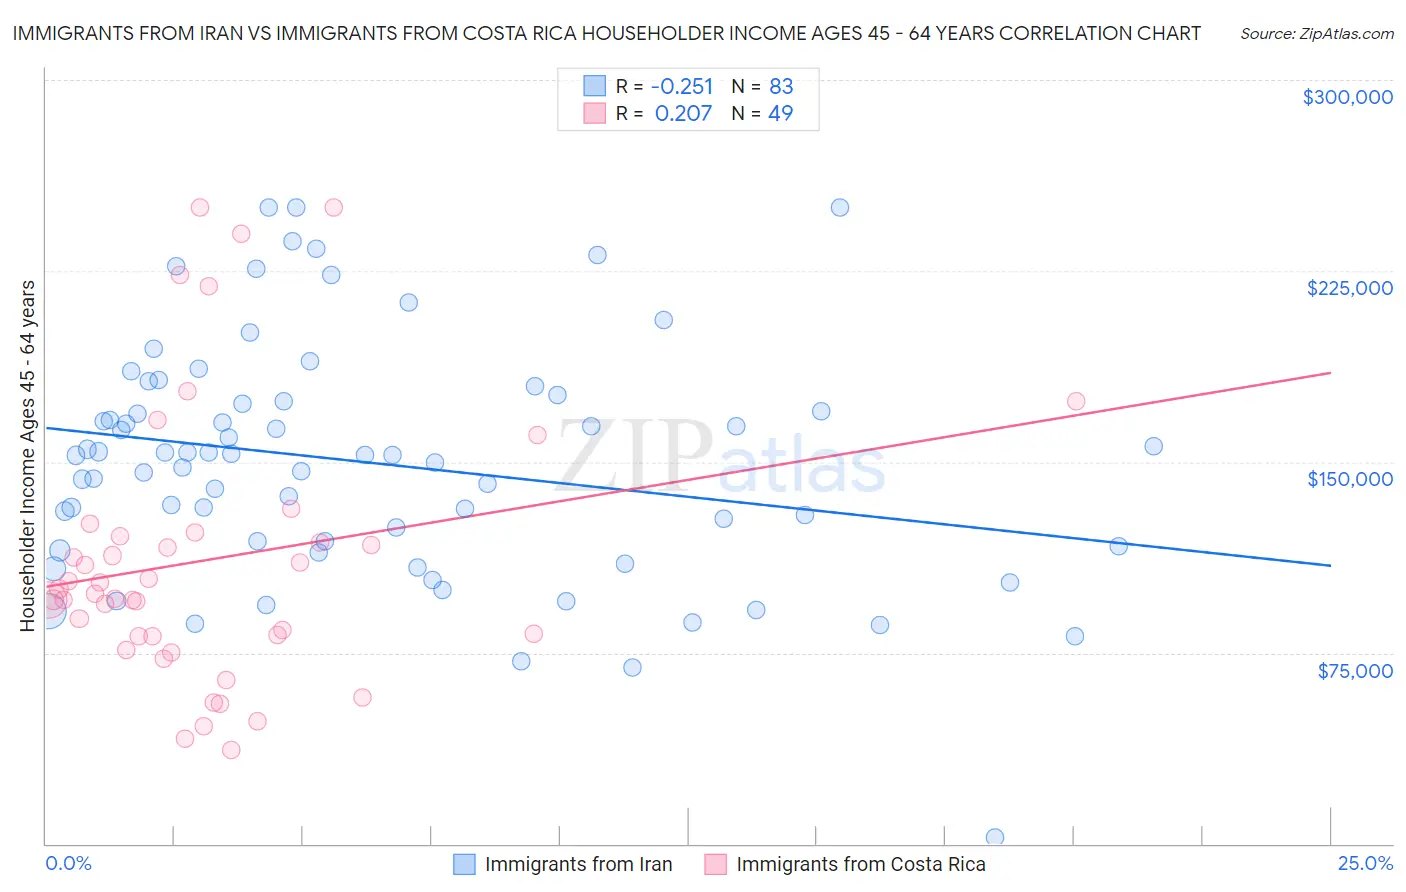
Immigrants from Iran vs Immigrants from Costa Rica Householder Income Ages 45 - 64 years Correlation Chart
The statistical analysis conducted on geographies consisting of 279,706,842 people shows a weak negative correlation between the proportion of Immigrants from Iran and household income with householder between the ages 45 and 64 in the United States with a correlation coefficient (R) of -0.251 and weighted average of $126,940. Similarly, the statistical analysis conducted on geographies consisting of 204,163,177 people shows a weak positive correlation between the proportion of Immigrants from Costa Rica and household income with householder between the ages 45 and 64 in the United States with a correlation coefficient (R) of 0.207 and weighted average of $100,141, a difference of 26.8%.
Householder Income Ages 45 - 64 years Correlation Summary
| Measurement | Immigrants from Iran | Immigrants from Costa Rica |
| Minimum | $2,499 | $36,667 |
| Maximum | $250,001 | $250,001 |
| Range | $247,502 | $213,334 |
| Mean | $149,657 | $111,542 |
| Median | $152,624 | $98,012 |
| Interquartile 25% (IQ1) | $116,625 | $81,355 |
| Interquartile 75% (IQ3) | $173,869 | $121,642 |
| Interquartile Range (IQR) | $57,244 | $40,287 |
| Standard Deviation (Sample) | $46,822 | $53,037 |
| Standard Deviation (Population) | $46,539 | $52,493 |
Similar Demographics by Householder Income Ages 45 - 64 years
Demographics Similar to Immigrants from Iran by Householder Income Ages 45 - 64 years
In terms of householder income ages 45 - 64 years, the demographic groups most similar to Immigrants from Iran are Immigrants from Hong Kong ($127,500, a difference of 0.44%), Okinawan ($124,796, a difference of 1.7%), Iranian ($129,350, a difference of 1.9%), Immigrants from Singapore ($129,514, a difference of 2.0%), and Thai ($129,560, a difference of 2.1%).
| Demographics | Rating | Rank | Householder Income Ages 45 - 64 years |
| Immigrants | Taiwan | 100.0 /100 | #1 | Exceptional $135,508 |
| Filipinos | 100.0 /100 | #2 | Exceptional $134,910 |
| Immigrants | India | 100.0 /100 | #3 | Exceptional $132,488 |
| Thais | 100.0 /100 | #4 | Exceptional $129,560 |
| Immigrants | Singapore | 100.0 /100 | #5 | Exceptional $129,514 |
| Iranians | 100.0 /100 | #6 | Exceptional $129,350 |
| Immigrants | Hong Kong | 100.0 /100 | #7 | Exceptional $127,500 |
| Immigrants | Iran | 100.0 /100 | #8 | Exceptional $126,940 |
| Okinawans | 100.0 /100 | #9 | Exceptional $124,796 |
| Immigrants | South Central Asia | 100.0 /100 | #10 | Exceptional $124,188 |
| Cypriots | 100.0 /100 | #11 | Exceptional $123,396 |
| Immigrants | Israel | 100.0 /100 | #12 | Exceptional $122,893 |
| Immigrants | Ireland | 100.0 /100 | #13 | Exceptional $122,757 |
| Indians (Asian) | 100.0 /100 | #14 | Exceptional $122,343 |
| Immigrants | Eastern Asia | 100.0 /100 | #15 | Exceptional $122,222 |
Demographics Similar to Immigrants from Costa Rica by Householder Income Ages 45 - 64 years
In terms of householder income ages 45 - 64 years, the demographic groups most similar to Immigrants from Costa Rica are Moroccan ($100,138, a difference of 0.0%), Immigrants from Cameroon ($100,084, a difference of 0.060%), German ($100,224, a difference of 0.080%), Belgian ($100,060, a difference of 0.080%), and Aleut ($100,052, a difference of 0.090%).
| Demographics | Rating | Rank | Householder Income Ages 45 - 64 years |
| Guamanians/Chamorros | 60.5 /100 | #169 | Good $101,170 |
| Slovaks | 58.8 /100 | #170 | Average $101,029 |
| South Americans | 56.4 /100 | #171 | Average $100,837 |
| Immigrants | Uzbekistan | 52.5 /100 | #172 | Average $100,523 |
| Alsatians | 51.4 /100 | #173 | Average $100,435 |
| Welsh | 50.0 /100 | #174 | Average $100,322 |
| Germans | 48.8 /100 | #175 | Average $100,224 |
| Immigrants | Costa Rica | 47.7 /100 | #176 | Average $100,141 |
| Moroccans | 47.7 /100 | #177 | Average $100,138 |
| Immigrants | Cameroon | 47.0 /100 | #178 | Average $100,084 |
| Belgians | 46.7 /100 | #179 | Average $100,060 |
| Aleuts | 46.6 /100 | #180 | Average $100,052 |
| Immigrants | Immigrants | 45.3 /100 | #181 | Average $99,943 |
| Finns | 44.8 /100 | #182 | Average $99,904 |
| Spaniards | 44.6 /100 | #183 | Average $99,889 |