Immigrants from Grenada vs Immigrants from Costa Rica Householder Income Ages 45 - 64 years
COMPARE
Immigrants from Grenada
Immigrants from Costa Rica
Householder Income Ages 45 - 64 years
Householder Income Ages 45 - 64 years Comparison
Immigrants from Grenada
Immigrants from Costa Rica
$85,552
HOUSEHOLDER INCOME AGES 45 - 64 YEARS
0.1/ 100
METRIC RATING
295th/ 347
METRIC RANK
$100,141
HOUSEHOLDER INCOME AGES 45 - 64 YEARS
47.7/ 100
METRIC RATING
176th/ 347
METRIC RANK
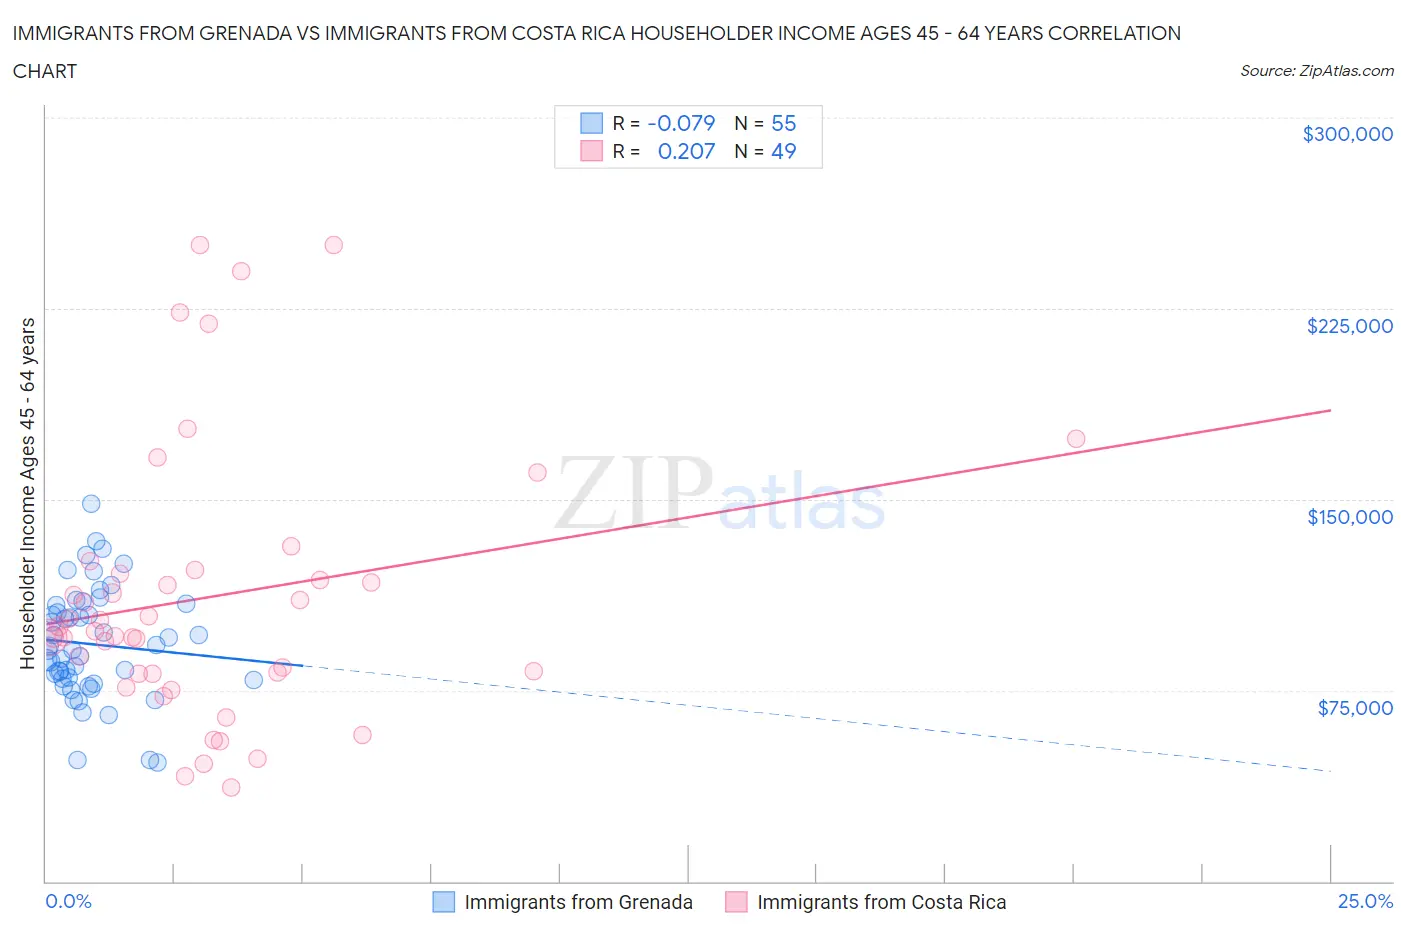
Immigrants from Grenada vs Immigrants from Costa Rica Householder Income Ages 45 - 64 years Correlation Chart
The statistical analysis conducted on geographies consisting of 67,175,109 people shows a slight negative correlation between the proportion of Immigrants from Grenada and household income with householder between the ages 45 and 64 in the United States with a correlation coefficient (R) of -0.079 and weighted average of $85,552. Similarly, the statistical analysis conducted on geographies consisting of 204,163,177 people shows a weak positive correlation between the proportion of Immigrants from Costa Rica and household income with householder between the ages 45 and 64 in the United States with a correlation coefficient (R) of 0.207 and weighted average of $100,141, a difference of 17.1%.
Householder Income Ages 45 - 64 years Correlation Summary
| Measurement | Immigrants from Grenada | Immigrants from Costa Rica |
| Minimum | $46,607 | $36,667 |
| Maximum | $148,164 | $250,001 |
| Range | $101,557 | $213,334 |
| Mean | $93,124 | $111,542 |
| Median | $90,758 | $98,012 |
| Interquartile 25% (IQ1) | $78,920 | $81,355 |
| Interquartile 75% (IQ3) | $108,561 | $121,642 |
| Interquartile Range (IQR) | $29,641 | $40,287 |
| Standard Deviation (Sample) | $21,622 | $53,037 |
| Standard Deviation (Population) | $21,425 | $52,493 |
Similar Demographics by Householder Income Ages 45 - 64 years
Demographics Similar to Immigrants from Grenada by Householder Income Ages 45 - 64 years
In terms of householder income ages 45 - 64 years, the demographic groups most similar to Immigrants from Grenada are British West Indian ($85,571, a difference of 0.020%), Comanche ($85,787, a difference of 0.27%), Immigrants from Zaire ($85,207, a difference of 0.40%), Fijian ($85,187, a difference of 0.43%), and Immigrants from Central America ($85,965, a difference of 0.48%).
| Demographics | Rating | Rank | Householder Income Ages 45 - 64 years |
| Immigrants | St. Vincent and the Grenadines | 0.1 /100 | #288 | Tragic $86,394 |
| Cubans | 0.1 /100 | #289 | Tragic $86,301 |
| Cherokee | 0.1 /100 | #290 | Tragic $86,125 |
| Hispanics or Latinos | 0.1 /100 | #291 | Tragic $86,006 |
| Immigrants | Central America | 0.1 /100 | #292 | Tragic $85,965 |
| Comanche | 0.1 /100 | #293 | Tragic $85,787 |
| British West Indians | 0.1 /100 | #294 | Tragic $85,571 |
| Immigrants | Grenada | 0.1 /100 | #295 | Tragic $85,552 |
| Immigrants | Zaire | 0.1 /100 | #296 | Tragic $85,207 |
| Fijians | 0.1 /100 | #297 | Tragic $85,187 |
| Africans | 0.0 /100 | #298 | Tragic $84,925 |
| Immigrants | Mexico | 0.0 /100 | #299 | Tragic $84,910 |
| Indonesians | 0.0 /100 | #300 | Tragic $84,890 |
| Potawatomi | 0.0 /100 | #301 | Tragic $84,613 |
| Haitians | 0.0 /100 | #302 | Tragic $84,384 |
Demographics Similar to Immigrants from Costa Rica by Householder Income Ages 45 - 64 years
In terms of householder income ages 45 - 64 years, the demographic groups most similar to Immigrants from Costa Rica are Moroccan ($100,138, a difference of 0.0%), Immigrants from Cameroon ($100,084, a difference of 0.060%), German ($100,224, a difference of 0.080%), Belgian ($100,060, a difference of 0.080%), and Aleut ($100,052, a difference of 0.090%).
| Demographics | Rating | Rank | Householder Income Ages 45 - 64 years |
| Guamanians/Chamorros | 60.5 /100 | #169 | Good $101,170 |
| Slovaks | 58.8 /100 | #170 | Average $101,029 |
| South Americans | 56.4 /100 | #171 | Average $100,837 |
| Immigrants | Uzbekistan | 52.5 /100 | #172 | Average $100,523 |
| Alsatians | 51.4 /100 | #173 | Average $100,435 |
| Welsh | 50.0 /100 | #174 | Average $100,322 |
| Germans | 48.8 /100 | #175 | Average $100,224 |
| Immigrants | Costa Rica | 47.7 /100 | #176 | Average $100,141 |
| Moroccans | 47.7 /100 | #177 | Average $100,138 |
| Immigrants | Cameroon | 47.0 /100 | #178 | Average $100,084 |
| Belgians | 46.7 /100 | #179 | Average $100,060 |
| Aleuts | 46.6 /100 | #180 | Average $100,052 |
| Immigrants | Immigrants | 45.3 /100 | #181 | Average $99,943 |
| Finns | 44.8 /100 | #182 | Average $99,904 |
| Spaniards | 44.6 /100 | #183 | Average $99,889 |