Immigrants from Iran vs Costa Rican Householder Income Ages 45 - 64 years
COMPARE
Immigrants from Iran
Costa Rican
Householder Income Ages 45 - 64 years
Householder Income Ages 45 - 64 years Comparison
Immigrants from Iran
Costa Ricans
$126,940
HOUSEHOLDER INCOME AGES 45 - 64 YEARS
100.0/ 100
METRIC RATING
8th/ 347
METRIC RANK
$102,779
HOUSEHOLDER INCOME AGES 45 - 64 YEARS
77.4/ 100
METRIC RATING
155th/ 347
METRIC RANK
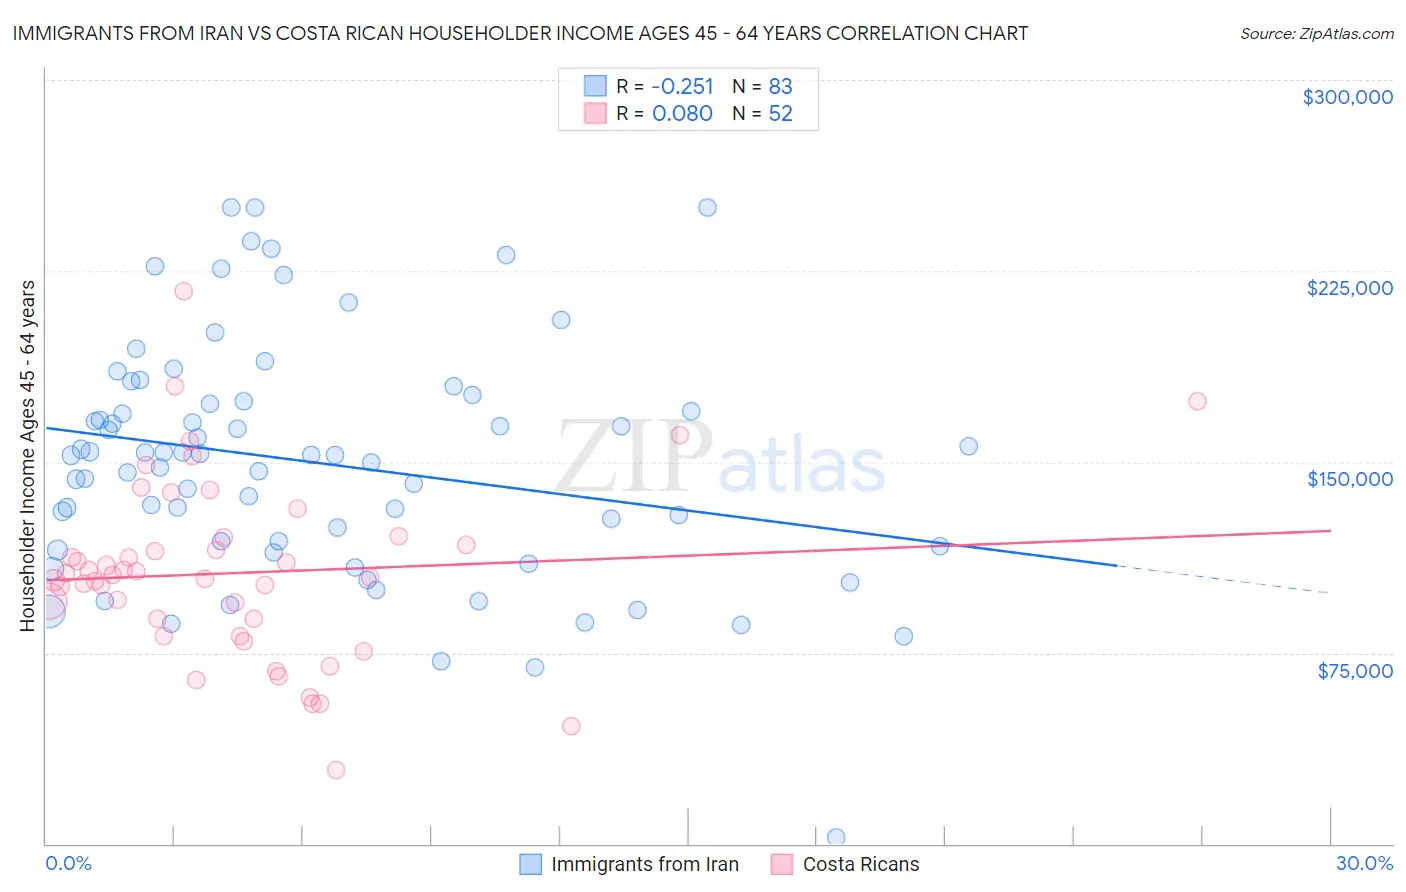
Immigrants from Iran vs Costa Rican Householder Income Ages 45 - 64 years Correlation Chart
The statistical analysis conducted on geographies consisting of 279,706,842 people shows a weak negative correlation between the proportion of Immigrants from Iran and household income with householder between the ages 45 and 64 in the United States with a correlation coefficient (R) of -0.251 and weighted average of $126,940. Similarly, the statistical analysis conducted on geographies consisting of 253,341,339 people shows a slight positive correlation between the proportion of Costa Ricans and household income with householder between the ages 45 and 64 in the United States with a correlation coefficient (R) of 0.080 and weighted average of $102,779, a difference of 23.5%.
Householder Income Ages 45 - 64 years Correlation Summary
| Measurement | Immigrants from Iran | Costa Rican |
| Minimum | $2,499 | $28,864 |
| Maximum | $250,001 | $217,009 |
| Range | $247,502 | $188,145 |
| Mean | $149,657 | $106,317 |
| Median | $152,624 | $104,965 |
| Interquartile 25% (IQ1) | $116,625 | $84,873 |
| Interquartile 75% (IQ3) | $173,869 | $118,891 |
| Interquartile Range (IQR) | $57,244 | $34,017 |
| Standard Deviation (Sample) | $46,822 | $35,393 |
| Standard Deviation (Population) | $46,539 | $35,051 |
Similar Demographics by Householder Income Ages 45 - 64 years
Demographics Similar to Immigrants from Iran by Householder Income Ages 45 - 64 years
In terms of householder income ages 45 - 64 years, the demographic groups most similar to Immigrants from Iran are Immigrants from Hong Kong ($127,500, a difference of 0.44%), Okinawan ($124,796, a difference of 1.7%), Iranian ($129,350, a difference of 1.9%), Immigrants from Singapore ($129,514, a difference of 2.0%), and Thai ($129,560, a difference of 2.1%).
| Demographics | Rating | Rank | Householder Income Ages 45 - 64 years |
| Immigrants | Taiwan | 100.0 /100 | #1 | Exceptional $135,508 |
| Filipinos | 100.0 /100 | #2 | Exceptional $134,910 |
| Immigrants | India | 100.0 /100 | #3 | Exceptional $132,488 |
| Thais | 100.0 /100 | #4 | Exceptional $129,560 |
| Immigrants | Singapore | 100.0 /100 | #5 | Exceptional $129,514 |
| Iranians | 100.0 /100 | #6 | Exceptional $129,350 |
| Immigrants | Hong Kong | 100.0 /100 | #7 | Exceptional $127,500 |
| Immigrants | Iran | 100.0 /100 | #8 | Exceptional $126,940 |
| Okinawans | 100.0 /100 | #9 | Exceptional $124,796 |
| Immigrants | South Central Asia | 100.0 /100 | #10 | Exceptional $124,188 |
| Cypriots | 100.0 /100 | #11 | Exceptional $123,396 |
| Immigrants | Israel | 100.0 /100 | #12 | Exceptional $122,893 |
| Immigrants | Ireland | 100.0 /100 | #13 | Exceptional $122,757 |
| Indians (Asian) | 100.0 /100 | #14 | Exceptional $122,343 |
| Immigrants | Eastern Asia | 100.0 /100 | #15 | Exceptional $122,222 |
Demographics Similar to Costa Ricans by Householder Income Ages 45 - 64 years
In terms of householder income ages 45 - 64 years, the demographic groups most similar to Costa Ricans are Carpatho Rusyn ($102,777, a difference of 0.0%), Immigrants from Ethiopia ($102,763, a difference of 0.020%), Slovene ($102,885, a difference of 0.10%), Slavic ($102,629, a difference of 0.15%), and Scandinavian ($102,969, a difference of 0.19%).
| Demographics | Rating | Rank | Householder Income Ages 45 - 64 years |
| Immigrants | Germany | 81.5 /100 | #148 | Excellent $103,282 |
| Immigrants | Sierra Leone | 81.1 /100 | #149 | Excellent $103,227 |
| Immigrants | Peru | 80.7 /100 | #150 | Excellent $103,173 |
| Swiss | 79.9 /100 | #151 | Good $103,071 |
| Irish | 79.8 /100 | #152 | Good $103,067 |
| Scandinavians | 79.0 /100 | #153 | Good $102,969 |
| Slovenes | 78.3 /100 | #154 | Good $102,885 |
| Costa Ricans | 77.4 /100 | #155 | Good $102,779 |
| Carpatho Rusyns | 77.4 /100 | #156 | Good $102,777 |
| Immigrants | Ethiopia | 77.3 /100 | #157 | Good $102,763 |
| Slavs | 76.1 /100 | #158 | Good $102,629 |
| Sierra Leoneans | 74.2 /100 | #159 | Good $102,427 |
| Icelanders | 72.5 /100 | #160 | Good $102,261 |
| Immigrants | Nepal | 71.8 /100 | #161 | Good $102,190 |
| Scottish | 71.1 /100 | #162 | Good $102,123 |