Austrian vs Immigrants from Costa Rica Householder Income Ages 45 - 64 years
COMPARE
Austrian
Immigrants from Costa Rica
Householder Income Ages 45 - 64 years
Householder Income Ages 45 - 64 years Comparison
Austrians
Immigrants from Costa Rica
$108,692
HOUSEHOLDER INCOME AGES 45 - 64 YEARS
98.5/ 100
METRIC RATING
86th/ 347
METRIC RANK
$100,141
HOUSEHOLDER INCOME AGES 45 - 64 YEARS
47.7/ 100
METRIC RATING
176th/ 347
METRIC RANK
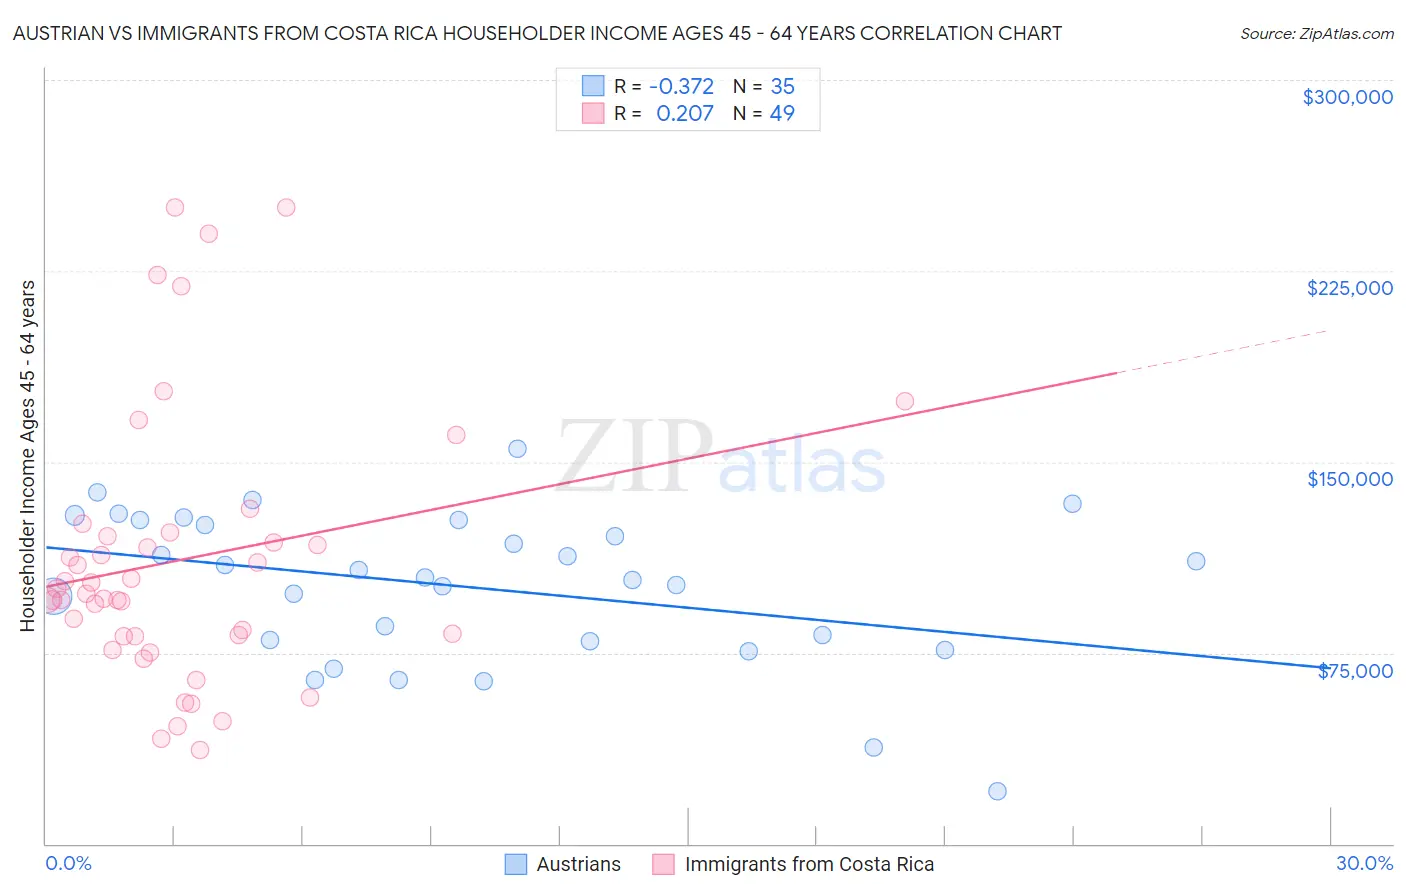
Austrian vs Immigrants from Costa Rica Householder Income Ages 45 - 64 years Correlation Chart
The statistical analysis conducted on geographies consisting of 451,173,379 people shows a mild negative correlation between the proportion of Austrians and household income with householder between the ages 45 and 64 in the United States with a correlation coefficient (R) of -0.372 and weighted average of $108,692. Similarly, the statistical analysis conducted on geographies consisting of 204,163,177 people shows a weak positive correlation between the proportion of Immigrants from Costa Rica and household income with householder between the ages 45 and 64 in the United States with a correlation coefficient (R) of 0.207 and weighted average of $100,141, a difference of 8.5%.
Householder Income Ages 45 - 64 years Correlation Summary
| Measurement | Austrian | Immigrants from Costa Rica |
| Minimum | $20,833 | $36,667 |
| Maximum | $155,000 | $250,001 |
| Range | $134,167 | $213,334 |
| Mean | $100,755 | $111,542 |
| Median | $104,463 | $98,012 |
| Interquartile 25% (IQ1) | $79,395 | $81,355 |
| Interquartile 75% (IQ3) | $126,954 | $121,642 |
| Interquartile Range (IQR) | $47,559 | $40,287 |
| Standard Deviation (Sample) | $29,820 | $53,037 |
| Standard Deviation (Population) | $29,391 | $52,493 |
Similar Demographics by Householder Income Ages 45 - 64 years
Demographics Similar to Austrians by Householder Income Ages 45 - 64 years
In terms of householder income ages 45 - 64 years, the demographic groups most similar to Austrians are Tongan ($108,643, a difference of 0.040%), Romanian ($108,609, a difference of 0.080%), Immigrants from Afghanistan ($108,785, a difference of 0.090%), Immigrants from Western Europe ($108,824, a difference of 0.12%), and Ukrainian ($108,475, a difference of 0.20%).
| Demographics | Rating | Rank | Householder Income Ages 45 - 64 years |
| Immigrants | Bulgaria | 98.9 /100 | #79 | Exceptional $109,379 |
| Jordanians | 98.9 /100 | #80 | Exceptional $109,376 |
| Immigrants | Eastern Europe | 98.9 /100 | #81 | Exceptional $109,335 |
| Immigrants | North America | 98.8 /100 | #82 | Exceptional $109,198 |
| Immigrants | Spain | 98.8 /100 | #83 | Exceptional $109,051 |
| Immigrants | Western Europe | 98.6 /100 | #84 | Exceptional $108,824 |
| Immigrants | Afghanistan | 98.6 /100 | #85 | Exceptional $108,785 |
| Austrians | 98.5 /100 | #86 | Exceptional $108,692 |
| Tongans | 98.5 /100 | #87 | Exceptional $108,643 |
| Romanians | 98.5 /100 | #88 | Exceptional $108,609 |
| Ukrainians | 98.3 /100 | #89 | Exceptional $108,475 |
| Immigrants | Philippines | 98.3 /100 | #90 | Exceptional $108,471 |
| Immigrants | Lebanon | 98.3 /100 | #91 | Exceptional $108,471 |
| Croatians | 98.3 /100 | #92 | Exceptional $108,383 |
| Immigrants | Croatia | 98.2 /100 | #93 | Exceptional $108,304 |
Demographics Similar to Immigrants from Costa Rica by Householder Income Ages 45 - 64 years
In terms of householder income ages 45 - 64 years, the demographic groups most similar to Immigrants from Costa Rica are Moroccan ($100,138, a difference of 0.0%), Immigrants from Cameroon ($100,084, a difference of 0.060%), German ($100,224, a difference of 0.080%), Belgian ($100,060, a difference of 0.080%), and Aleut ($100,052, a difference of 0.090%).
| Demographics | Rating | Rank | Householder Income Ages 45 - 64 years |
| Guamanians/Chamorros | 60.5 /100 | #169 | Good $101,170 |
| Slovaks | 58.8 /100 | #170 | Average $101,029 |
| South Americans | 56.4 /100 | #171 | Average $100,837 |
| Immigrants | Uzbekistan | 52.5 /100 | #172 | Average $100,523 |
| Alsatians | 51.4 /100 | #173 | Average $100,435 |
| Welsh | 50.0 /100 | #174 | Average $100,322 |
| Germans | 48.8 /100 | #175 | Average $100,224 |
| Immigrants | Costa Rica | 47.7 /100 | #176 | Average $100,141 |
| Moroccans | 47.7 /100 | #177 | Average $100,138 |
| Immigrants | Cameroon | 47.0 /100 | #178 | Average $100,084 |
| Belgians | 46.7 /100 | #179 | Average $100,060 |
| Aleuts | 46.6 /100 | #180 | Average $100,052 |
| Immigrants | Immigrants | 45.3 /100 | #181 | Average $99,943 |
| Finns | 44.8 /100 | #182 | Average $99,904 |
| Spaniards | 44.6 /100 | #183 | Average $99,889 |