Immigrants from Honduras vs Immigrants from North Macedonia Median Female Earnings
COMPARE
Immigrants from Honduras
Immigrants from North Macedonia
Median Female Earnings
Median Female Earnings Comparison
Immigrants from Honduras
Immigrants from North Macedonia
$34,647
MEDIAN FEMALE EARNINGS
0.0/ 100
METRIC RATING
320th/ 347
METRIC RANK
$40,488
MEDIAN FEMALE EARNINGS
83.8/ 100
METRIC RATING
144th/ 347
METRIC RANK
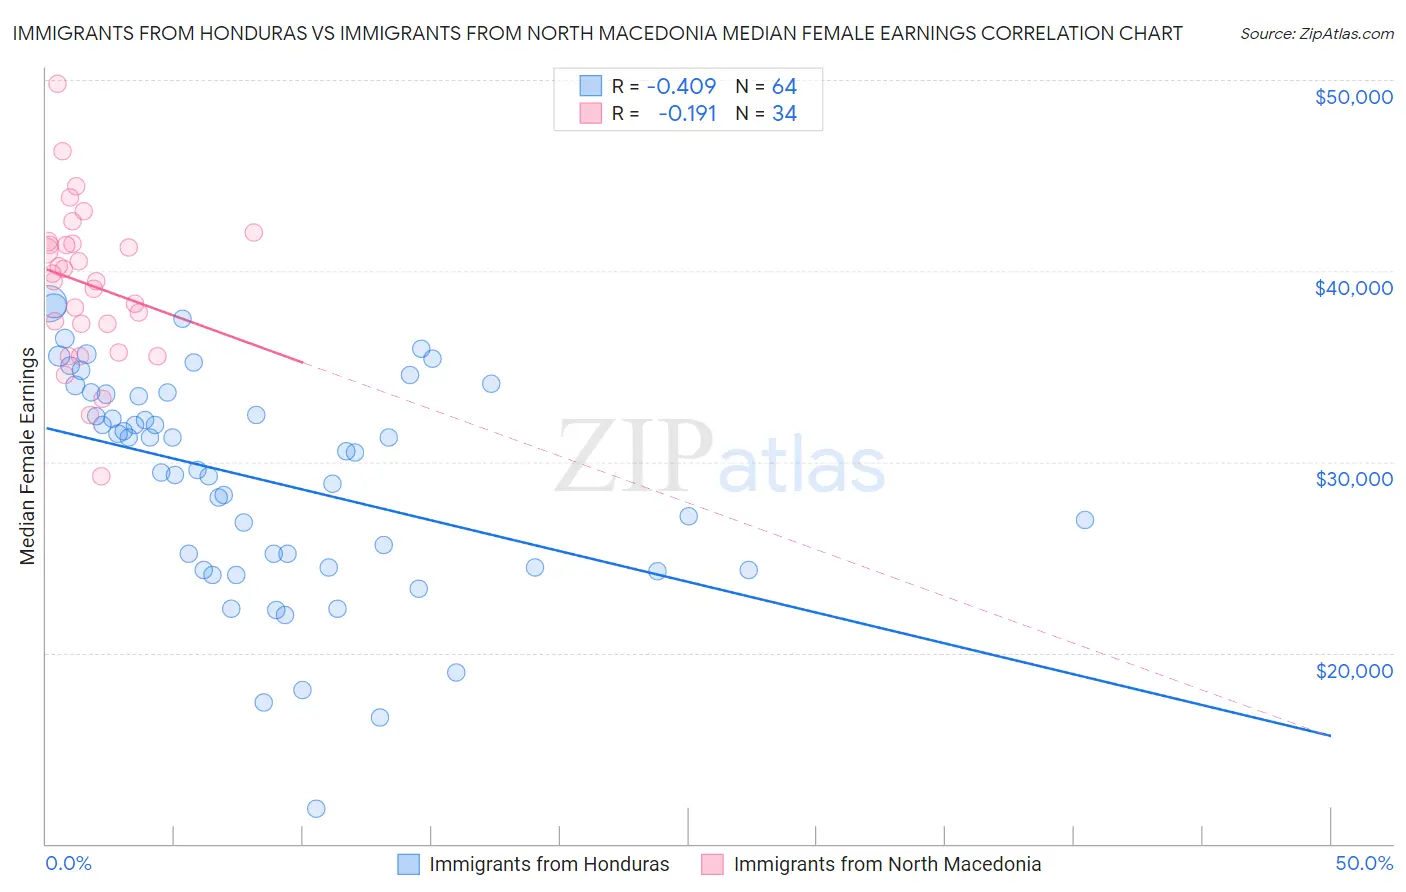
Immigrants from Honduras vs Immigrants from North Macedonia Median Female Earnings Correlation Chart
The statistical analysis conducted on geographies consisting of 322,483,540 people shows a moderate negative correlation between the proportion of Immigrants from Honduras and median female earnings in the United States with a correlation coefficient (R) of -0.409 and weighted average of $34,647. Similarly, the statistical analysis conducted on geographies consisting of 74,042,106 people shows a poor negative correlation between the proportion of Immigrants from North Macedonia and median female earnings in the United States with a correlation coefficient (R) of -0.191 and weighted average of $40,488, a difference of 16.9%.
Median Female Earnings Correlation Summary
| Measurement | Immigrants from Honduras | Immigrants from North Macedonia |
| Minimum | $11,806 | $29,254 |
| Maximum | $38,285 | $49,827 |
| Range | $26,479 | $20,573 |
| Mean | $29,050 | $39,315 |
| Median | $30,512 | $39,666 |
| Interquartile 25% (IQ1) | $24,494 | $37,214 |
| Interquartile 75% (IQ3) | $33,580 | $41,437 |
| Interquartile Range (IQR) | $9,087 | $4,223 |
| Standard Deviation (Sample) | $5,773 | $4,067 |
| Standard Deviation (Population) | $5,727 | $4,007 |
Similar Demographics by Median Female Earnings
Demographics Similar to Immigrants from Honduras by Median Female Earnings
In terms of median female earnings, the demographic groups most similar to Immigrants from Honduras are Shoshone ($34,677, a difference of 0.090%), Immigrants from Yemen ($34,693, a difference of 0.13%), Cherokee ($34,742, a difference of 0.27%), Potawatomi ($34,739, a difference of 0.27%), and Pennsylvania German ($34,802, a difference of 0.45%).
| Demographics | Rating | Rank | Median Female Earnings |
| Cubans | 0.0 /100 | #313 | Tragic $34,942 |
| Apache | 0.0 /100 | #314 | Tragic $34,895 |
| Pennsylvania Germans | 0.0 /100 | #315 | Tragic $34,802 |
| Cherokee | 0.0 /100 | #316 | Tragic $34,742 |
| Potawatomi | 0.0 /100 | #317 | Tragic $34,739 |
| Immigrants | Yemen | 0.0 /100 | #318 | Tragic $34,693 |
| Shoshone | 0.0 /100 | #319 | Tragic $34,677 |
| Immigrants | Honduras | 0.0 /100 | #320 | Tragic $34,647 |
| Hispanics or Latinos | 0.0 /100 | #321 | Tragic $34,421 |
| Chickasaw | 0.0 /100 | #322 | Tragic $34,414 |
| Seminole | 0.0 /100 | #323 | Tragic $34,385 |
| Immigrants | Congo | 0.0 /100 | #324 | Tragic $34,317 |
| Dutch West Indians | 0.0 /100 | #325 | Tragic $34,106 |
| Kiowa | 0.0 /100 | #326 | Tragic $34,074 |
| Cajuns | 0.0 /100 | #327 | Tragic $34,034 |
Demographics Similar to Immigrants from North Macedonia by Median Female Earnings
In terms of median female earnings, the demographic groups most similar to Immigrants from North Macedonia are Northern European ($40,491, a difference of 0.010%), Brazilian ($40,483, a difference of 0.010%), Sri Lankan ($40,496, a difference of 0.020%), Immigrants from Syria ($40,499, a difference of 0.030%), and Serbian ($40,539, a difference of 0.12%).
| Demographics | Rating | Rank | Median Female Earnings |
| Pakistanis | 86.6 /100 | #137 | Excellent $40,596 |
| Taiwanese | 86.1 /100 | #138 | Excellent $40,576 |
| Immigrants | South Eastern Asia | 85.7 /100 | #139 | Excellent $40,558 |
| Serbians | 85.2 /100 | #140 | Excellent $40,539 |
| Immigrants | Syria | 84.1 /100 | #141 | Excellent $40,499 |
| Sri Lankans | 84.0 /100 | #142 | Excellent $40,496 |
| Northern Europeans | 83.9 /100 | #143 | Excellent $40,491 |
| Immigrants | North Macedonia | 83.8 /100 | #144 | Excellent $40,488 |
| Brazilians | 83.6 /100 | #145 | Excellent $40,483 |
| Ghanaians | 82.1 /100 | #146 | Excellent $40,429 |
| Vietnamese | 80.4 /100 | #147 | Excellent $40,377 |
| Poles | 80.2 /100 | #148 | Excellent $40,371 |
| Immigrants | Cameroon | 79.7 /100 | #149 | Good $40,354 |
| Immigrants | Chile | 79.6 /100 | #150 | Good $40,353 |
| Immigrants | Armenia | 79.2 /100 | #151 | Good $40,340 |