Immigrants from Haiti vs Immigrants from Pakistan Median Family Income
COMPARE
Immigrants from Haiti
Immigrants from Pakistan
Median Family Income
Median Family Income Comparison
Immigrants from Haiti
Immigrants from Pakistan
$84,018
MEDIAN FAMILY INCOME
0.0/ 100
METRIC RATING
316th/ 347
METRIC RANK
$114,406
MEDIAN FAMILY INCOME
99.8/ 100
METRIC RATING
63rd/ 347
METRIC RANK
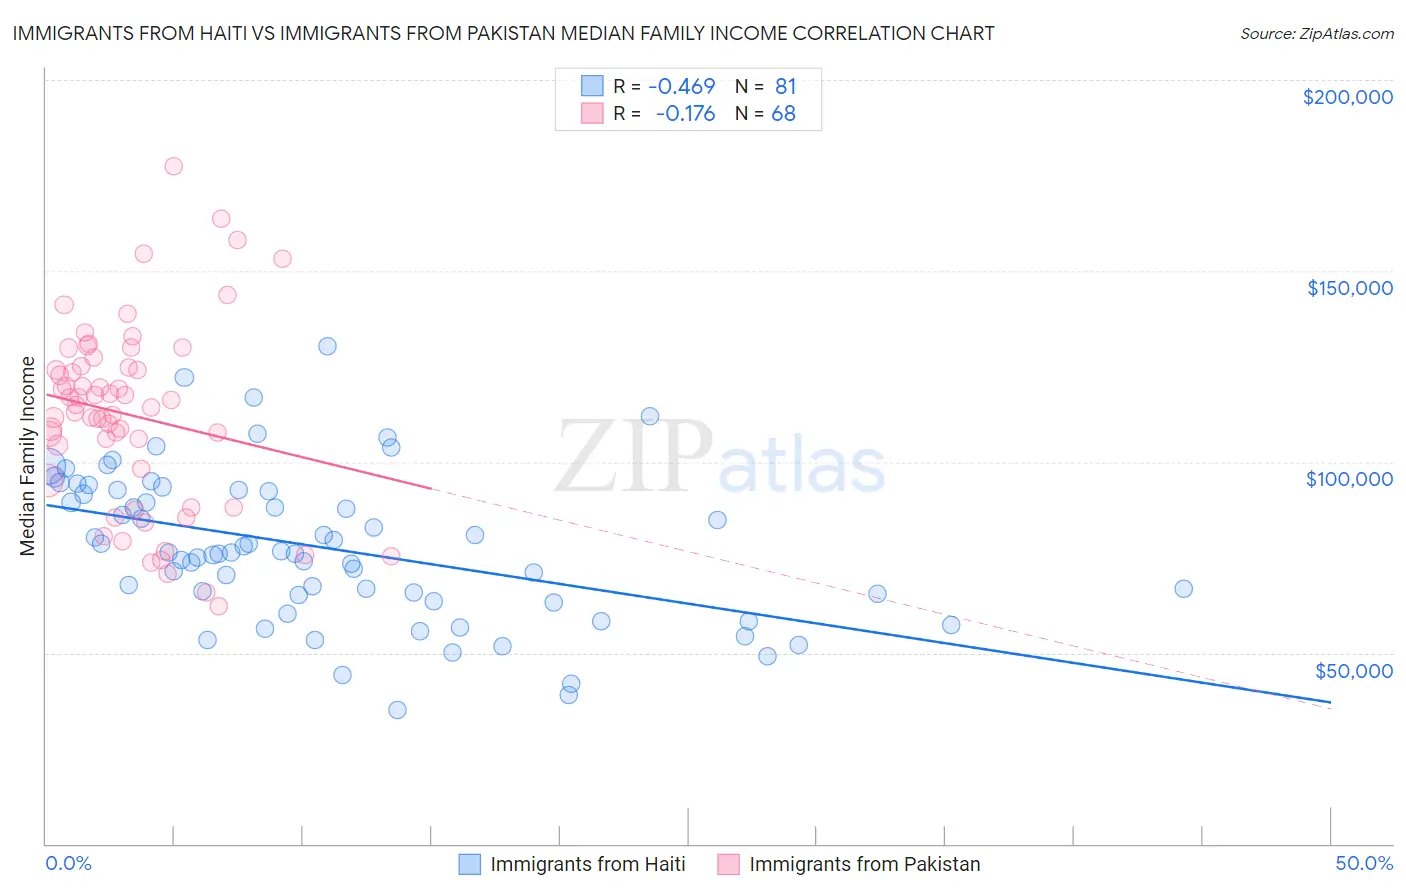
Immigrants from Haiti vs Immigrants from Pakistan Median Family Income Correlation Chart
The statistical analysis conducted on geographies consisting of 225,107,869 people shows a moderate negative correlation between the proportion of Immigrants from Haiti and median family income in the United States with a correlation coefficient (R) of -0.469 and weighted average of $84,018. Similarly, the statistical analysis conducted on geographies consisting of 283,715,977 people shows a poor negative correlation between the proportion of Immigrants from Pakistan and median family income in the United States with a correlation coefficient (R) of -0.176 and weighted average of $114,406, a difference of 36.2%.
Median Family Income Correlation Summary
| Measurement | Immigrants from Haiti | Immigrants from Pakistan |
| Minimum | $34,916 | $62,310 |
| Maximum | $130,212 | $177,453 |
| Range | $95,296 | $115,143 |
| Mean | $77,415 | $112,240 |
| Median | $76,203 | $114,706 |
| Interquartile 25% (IQ1) | $64,411 | $96,673 |
| Interquartile 75% (IQ3) | $92,467 | $124,867 |
| Interquartile Range (IQR) | $28,056 | $28,194 |
| Standard Deviation (Sample) | $19,581 | $24,169 |
| Standard Deviation (Population) | $19,460 | $23,991 |
Similar Demographics by Median Family Income
Demographics Similar to Immigrants from Haiti by Median Family Income
In terms of median family income, the demographic groups most similar to Immigrants from Haiti are Yakama ($83,932, a difference of 0.10%), Immigrants from Mexico ($83,639, a difference of 0.45%), Immigrants from Honduras ($83,618, a difference of 0.48%), Apache ($84,451, a difference of 0.52%), and Seminole ($83,354, a difference of 0.80%).
| Demographics | Rating | Rank | Median Family Income |
| Haitians | 0.0 /100 | #309 | Tragic $85,218 |
| Immigrants | Central America | 0.0 /100 | #310 | Tragic $85,050 |
| Hondurans | 0.0 /100 | #311 | Tragic $85,004 |
| Cubans | 0.0 /100 | #312 | Tragic $84,981 |
| Choctaw | 0.0 /100 | #313 | Tragic $84,835 |
| Immigrants | Bahamas | 0.0 /100 | #314 | Tragic $84,732 |
| Apache | 0.0 /100 | #315 | Tragic $84,451 |
| Immigrants | Haiti | 0.0 /100 | #316 | Tragic $84,018 |
| Yakama | 0.0 /100 | #317 | Tragic $83,932 |
| Immigrants | Mexico | 0.0 /100 | #318 | Tragic $83,639 |
| Immigrants | Honduras | 0.0 /100 | #319 | Tragic $83,618 |
| Seminole | 0.0 /100 | #320 | Tragic $83,354 |
| Immigrants | Caribbean | 0.0 /100 | #321 | Tragic $83,319 |
| Dominicans | 0.0 /100 | #322 | Tragic $82,888 |
| Bahamians | 0.0 /100 | #323 | Tragic $82,631 |
Demographics Similar to Immigrants from Pakistan by Median Family Income
In terms of median family income, the demographic groups most similar to Immigrants from Pakistan are Immigrants from Scotland ($114,392, a difference of 0.010%), Mongolian ($114,553, a difference of 0.13%), Immigrants from Belarus ($114,586, a difference of 0.16%), Egyptian ($114,119, a difference of 0.25%), and Paraguayan ($114,016, a difference of 0.34%).
| Demographics | Rating | Rank | Median Family Income |
| New Zealanders | 99.8 /100 | #56 | Exceptional $115,230 |
| Greeks | 99.8 /100 | #57 | Exceptional $115,192 |
| Immigrants | Indonesia | 99.8 /100 | #58 | Exceptional $115,162 |
| Immigrants | Netherlands | 99.8 /100 | #59 | Exceptional $114,987 |
| Immigrants | Latvia | 99.8 /100 | #60 | Exceptional $114,826 |
| Immigrants | Belarus | 99.8 /100 | #61 | Exceptional $114,586 |
| Mongolians | 99.8 /100 | #62 | Exceptional $114,553 |
| Immigrants | Pakistan | 99.8 /100 | #63 | Exceptional $114,406 |
| Immigrants | Scotland | 99.7 /100 | #64 | Exceptional $114,392 |
| Egyptians | 99.7 /100 | #65 | Exceptional $114,119 |
| Paraguayans | 99.7 /100 | #66 | Exceptional $114,016 |
| Immigrants | Spain | 99.7 /100 | #67 | Exceptional $113,815 |
| Immigrants | Serbia | 99.6 /100 | #68 | Exceptional $113,463 |
| Immigrants | Bulgaria | 99.6 /100 | #69 | Exceptional $113,461 |
| Immigrants | Romania | 99.6 /100 | #70 | Exceptional $113,434 |