Immigrants from France vs Bulgarian Median Earnings
COMPARE
Immigrants from France
Bulgarian
Median Earnings
Median Earnings Comparison
Immigrants from France
Bulgarians
$53,490
MEDIAN EARNINGS
100.0/ 100
METRIC RATING
28th/ 347
METRIC RANK
$52,512
MEDIAN EARNINGS
100.0/ 100
METRIC RATING
44th/ 347
METRIC RANK
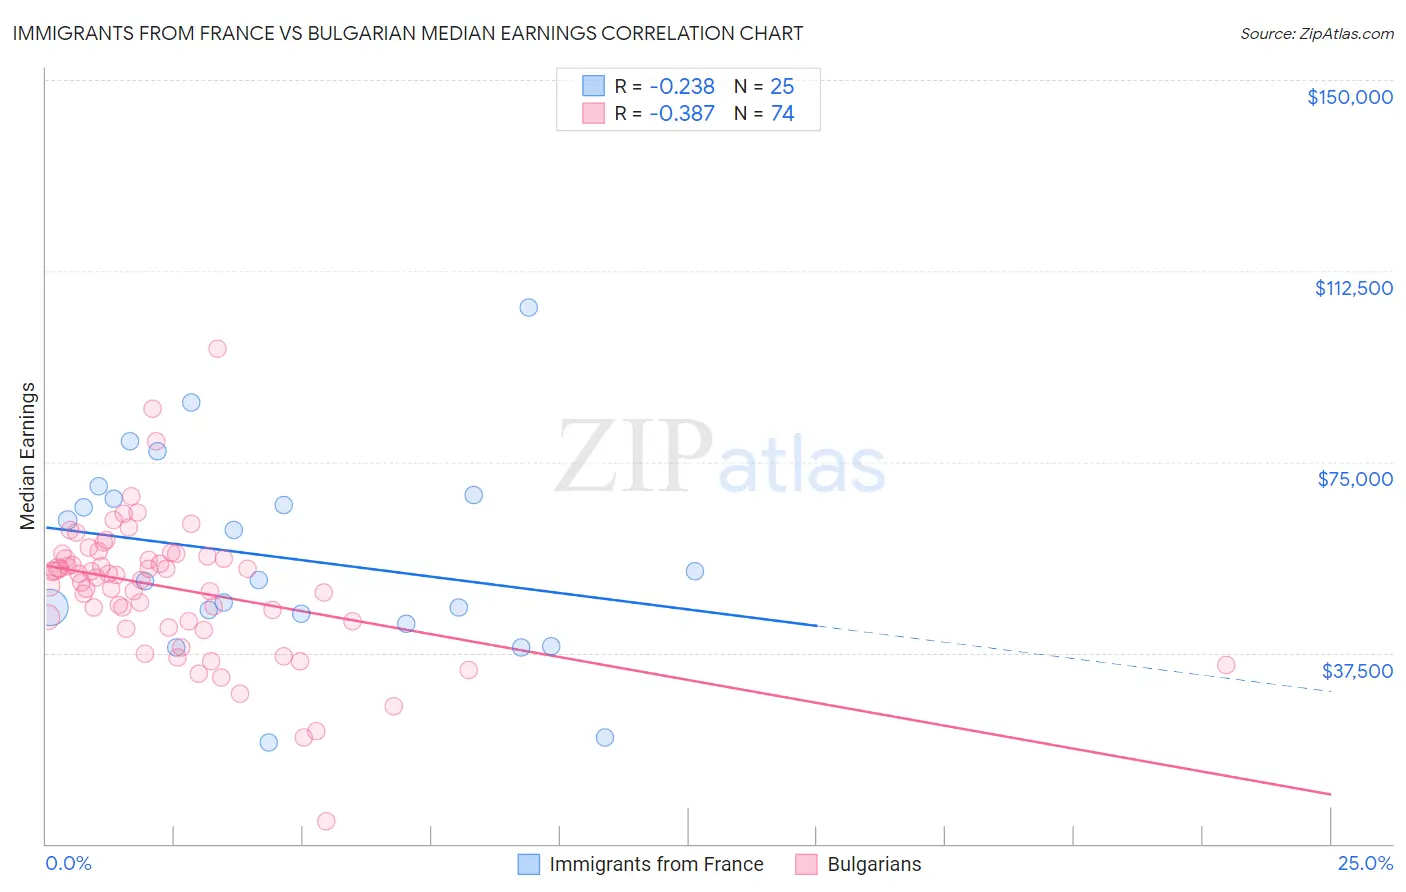
Immigrants from France vs Bulgarian Median Earnings Correlation Chart
The statistical analysis conducted on geographies consisting of 287,897,093 people shows a weak negative correlation between the proportion of Immigrants from France and median earnings in the United States with a correlation coefficient (R) of -0.238 and weighted average of $53,490. Similarly, the statistical analysis conducted on geographies consisting of 205,611,933 people shows a mild negative correlation between the proportion of Bulgarians and median earnings in the United States with a correlation coefficient (R) of -0.387 and weighted average of $52,512, a difference of 1.9%.
Median Earnings Correlation Summary
| Measurement | Immigrants from France | Bulgarian |
| Minimum | $19,781 | $4,447 |
| Maximum | $105,221 | $97,313 |
| Range | $85,440 | $92,866 |
| Mean | $56,012 | $50,155 |
| Median | $51,881 | $52,637 |
| Interquartile 25% (IQ1) | $44,190 | $43,589 |
| Interquartile 75% (IQ3) | $68,204 | $56,548 |
| Interquartile Range (IQR) | $24,013 | $12,959 |
| Standard Deviation (Sample) | $19,673 | $13,758 |
| Standard Deviation (Population) | $19,276 | $13,665 |
Demographics Similar to Immigrants from France and Bulgarians by Median Earnings
In terms of median earnings, the demographic groups most similar to Immigrants from France are Immigrants from Russia ($53,457, a difference of 0.060%), Cambodian ($53,386, a difference of 0.20%), Russian ($53,334, a difference of 0.29%), Immigrants from Asia ($53,310, a difference of 0.34%), and Asian ($53,690, a difference of 0.37%). Similarly, the demographic groups most similar to Bulgarians are Immigrants from Malaysia ($52,514, a difference of 0.0%), Maltese ($52,526, a difference of 0.030%), Immigrants from Czechoslovakia ($52,361, a difference of 0.29%), Bhutanese ($52,297, a difference of 0.41%), and Immigrants from Lithuania ($52,769, a difference of 0.49%).
| Demographics | Rating | Rank | Median Earnings |
| Immigrants | Northern Europe | 100.0 /100 | #26 | Exceptional $53,872 |
| Asians | 100.0 /100 | #27 | Exceptional $53,690 |
| Immigrants | France | 100.0 /100 | #28 | Exceptional $53,490 |
| Immigrants | Russia | 100.0 /100 | #29 | Exceptional $53,457 |
| Cambodians | 100.0 /100 | #30 | Exceptional $53,386 |
| Russians | 100.0 /100 | #31 | Exceptional $53,334 |
| Immigrants | Asia | 100.0 /100 | #32 | Exceptional $53,310 |
| Immigrants | Greece | 100.0 /100 | #33 | Exceptional $53,282 |
| Immigrants | Sri Lanka | 100.0 /100 | #34 | Exceptional $53,268 |
| Immigrants | Switzerland | 100.0 /100 | #35 | Exceptional $53,211 |
| Immigrants | Denmark | 100.0 /100 | #36 | Exceptional $53,186 |
| Immigrants | Belarus | 100.0 /100 | #37 | Exceptional $53,043 |
| Latvians | 100.0 /100 | #38 | Exceptional $53,001 |
| Immigrants | Turkey | 100.0 /100 | #39 | Exceptional $52,960 |
| Israelis | 100.0 /100 | #40 | Exceptional $52,937 |
| Immigrants | Lithuania | 100.0 /100 | #41 | Exceptional $52,769 |
| Maltese | 100.0 /100 | #42 | Exceptional $52,526 |
| Immigrants | Malaysia | 100.0 /100 | #43 | Exceptional $52,514 |
| Bulgarians | 100.0 /100 | #44 | Exceptional $52,512 |
| Immigrants | Czechoslovakia | 100.0 /100 | #45 | Exceptional $52,361 |
| Bhutanese | 100.0 /100 | #46 | Exceptional $52,297 |