Turkish vs Yup'ik Per Capita Income
COMPARE
Turkish
Yup'ik
Per Capita Income
Per Capita Income Comparison
Turks
Yup'ik
$52,391
PER CAPITA INCOME
100.0/ 100
METRIC RATING
31st/ 347
METRIC RANK
$30,518
PER CAPITA INCOME
0.0/ 100
METRIC RATING
344th/ 347
METRIC RANK
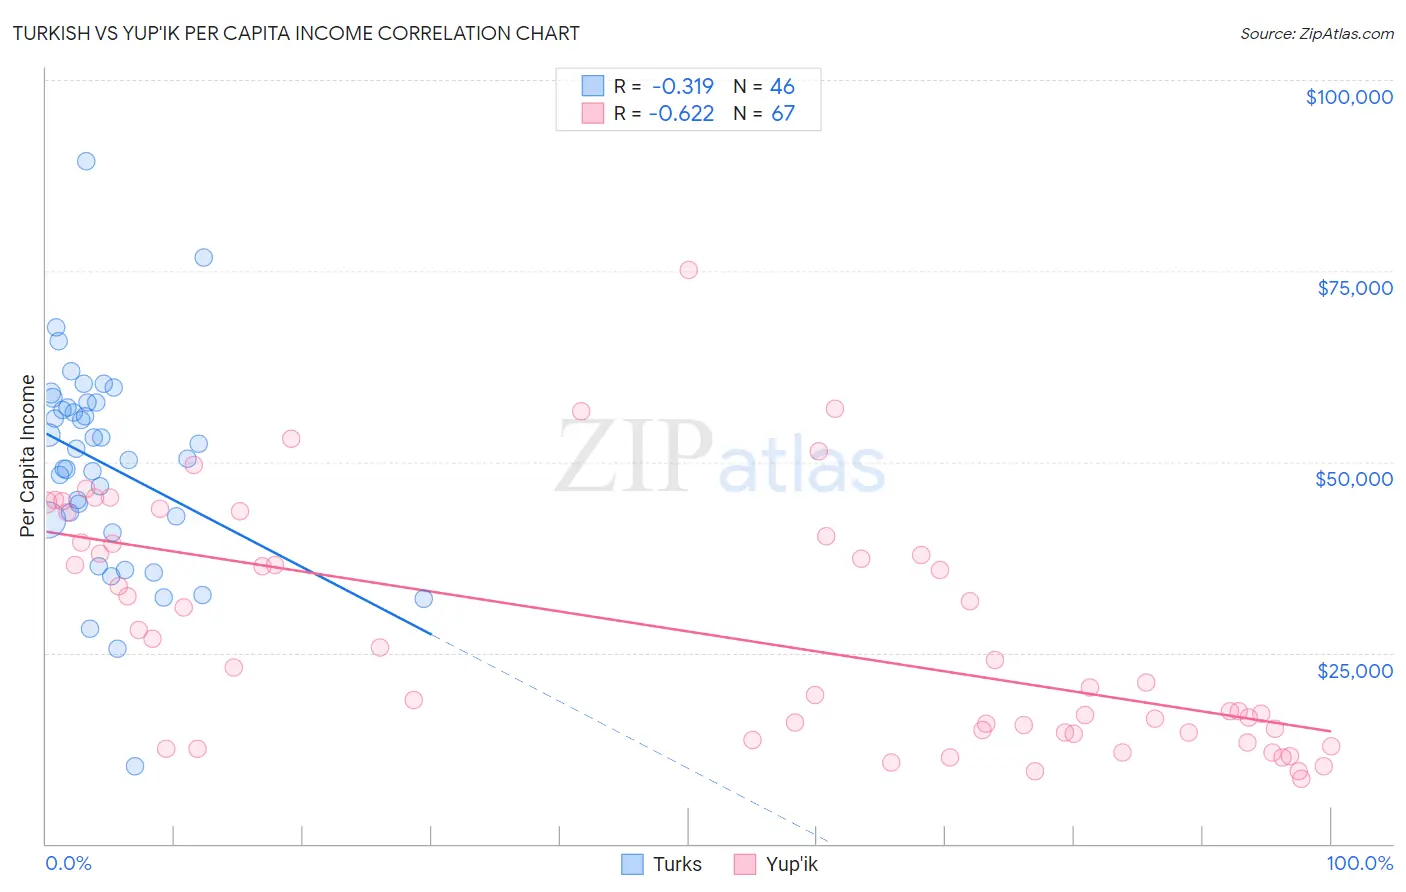
Turkish vs Yup'ik Per Capita Income Correlation Chart
The statistical analysis conducted on geographies consisting of 271,859,983 people shows a mild negative correlation between the proportion of Turks and per capita income in the United States with a correlation coefficient (R) of -0.319 and weighted average of $52,391. Similarly, the statistical analysis conducted on geographies consisting of 39,964,789 people shows a significant negative correlation between the proportion of Yup'ik and per capita income in the United States with a correlation coefficient (R) of -0.622 and weighted average of $30,518, a difference of 71.7%.
Per Capita Income Correlation Summary
| Measurement | Turkish | Yup'ik |
| Minimum | $10,169 | $8,508 |
| Maximum | $89,333 | $75,144 |
| Range | $79,164 | $66,636 |
| Mean | $49,588 | $27,634 |
| Median | $51,043 | $23,141 |
| Interquartile 25% (IQ1) | $42,405 | $14,540 |
| Interquartile 75% (IQ3) | $57,708 | $39,384 |
| Interquartile Range (IQR) | $15,302 | $24,844 |
| Standard Deviation (Sample) | $13,772 | $15,386 |
| Standard Deviation (Population) | $13,621 | $15,271 |
Similar Demographics by Per Capita Income
Demographics Similar to Turks by Per Capita Income
In terms of per capita income, the demographic groups most similar to Turks are Immigrants from Austria ($52,503, a difference of 0.21%), Immigrants from Norway ($52,217, a difference of 0.33%), Israeli ($52,596, a difference of 0.39%), Latvian ($52,649, a difference of 0.49%), and Immigrants from South Central Asia ($52,660, a difference of 0.51%).
| Demographics | Rating | Rank | Per Capita Income |
| Immigrants | Denmark | 100.0 /100 | #24 | Exceptional $53,799 |
| Immigrants | Japan | 100.0 /100 | #25 | Exceptional $53,359 |
| Russians | 100.0 /100 | #26 | Exceptional $53,154 |
| Immigrants | South Central Asia | 100.0 /100 | #27 | Exceptional $52,660 |
| Latvians | 100.0 /100 | #28 | Exceptional $52,649 |
| Israelis | 100.0 /100 | #29 | Exceptional $52,596 |
| Immigrants | Austria | 100.0 /100 | #30 | Exceptional $52,503 |
| Turks | 100.0 /100 | #31 | Exceptional $52,391 |
| Immigrants | Norway | 100.0 /100 | #32 | Exceptional $52,217 |
| Australians | 100.0 /100 | #33 | Exceptional $52,074 |
| Immigrants | Russia | 100.0 /100 | #34 | Exceptional $52,044 |
| Burmese | 100.0 /100 | #35 | Exceptional $52,005 |
| Immigrants | Greece | 100.0 /100 | #36 | Exceptional $51,891 |
| Estonians | 100.0 /100 | #37 | Exceptional $51,875 |
| Immigrants | Czechoslovakia | 100.0 /100 | #38 | Exceptional $51,770 |
Demographics Similar to Yup'ik by Per Capita Income
In terms of per capita income, the demographic groups most similar to Yup'ik are Pima ($30,644, a difference of 0.41%), Tohono O'odham ($30,256, a difference of 0.87%), Hopi ($31,177, a difference of 2.2%), Lumbee ($29,845, a difference of 2.3%), and Puerto Rican ($31,268, a difference of 2.5%).
| Demographics | Rating | Rank | Per Capita Income |
| Immigrants | Yemen | 0.0 /100 | #333 | Tragic $33,696 |
| Natives/Alaskans | 0.0 /100 | #334 | Tragic $33,279 |
| Yuman | 0.0 /100 | #335 | Tragic $33,236 |
| Yakama | 0.0 /100 | #336 | Tragic $33,009 |
| Houma | 0.0 /100 | #337 | Tragic $32,996 |
| Arapaho | 0.0 /100 | #338 | Tragic $32,345 |
| Pueblo | 0.0 /100 | #339 | Tragic $32,012 |
| Crow | 0.0 /100 | #340 | Tragic $31,729 |
| Puerto Ricans | 0.0 /100 | #341 | Tragic $31,268 |
| Hopi | 0.0 /100 | #342 | Tragic $31,177 |
| Pima | 0.0 /100 | #343 | Tragic $30,644 |
| Yup'ik | 0.0 /100 | #344 | Tragic $30,518 |
| Tohono O'odham | 0.0 /100 | #345 | Tragic $30,256 |
| Lumbee | 0.0 /100 | #346 | Tragic $29,845 |
| Navajo | 0.0 /100 | #347 | Tragic $29,031 |