Immigrants from St. Vincent and the Grenadines vs Lumbee Median Household Income
COMPARE
Immigrants from St. Vincent and the Grenadines
Lumbee
Median Household Income
Median Household Income Comparison
Immigrants from St. Vincent and the Grenadines
Lumbee
$77,690
MEDIAN HOUSEHOLD INCOME
0.9/ 100
METRIC RATING
253rd/ 347
METRIC RANK
$54,644
MEDIAN HOUSEHOLD INCOME
0.0/ 100
METRIC RATING
347th/ 347
METRIC RANK
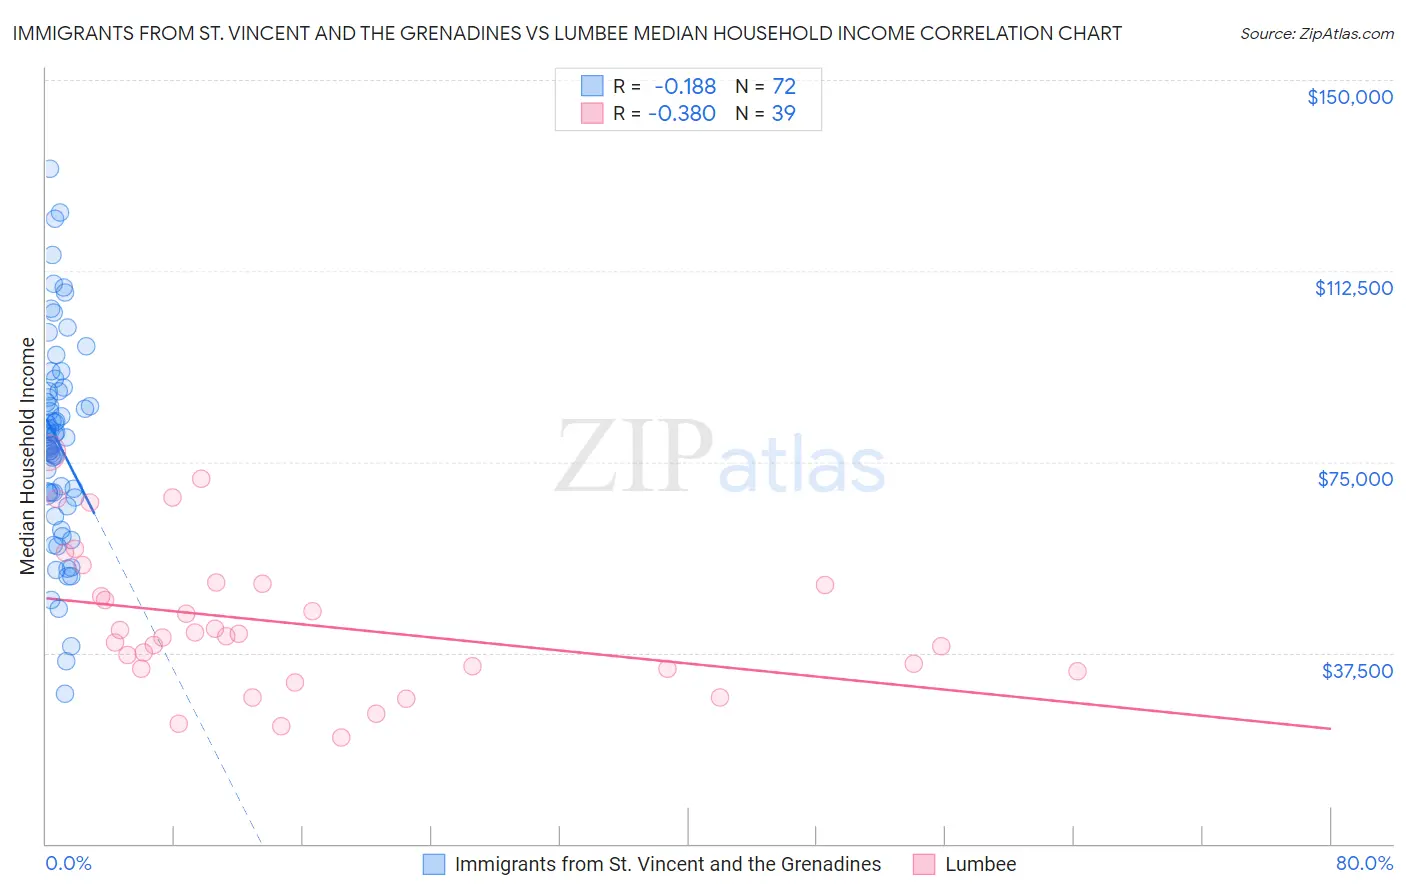
Immigrants from St. Vincent and the Grenadines vs Lumbee Median Household Income Correlation Chart
The statistical analysis conducted on geographies consisting of 56,186,980 people shows a poor negative correlation between the proportion of Immigrants from St. Vincent and the Grenadines and median household income in the United States with a correlation coefficient (R) of -0.188 and weighted average of $77,690. Similarly, the statistical analysis conducted on geographies consisting of 92,249,872 people shows a mild negative correlation between the proportion of Lumbee and median household income in the United States with a correlation coefficient (R) of -0.380 and weighted average of $54,644, a difference of 42.2%.
Median Household Income Correlation Summary
| Measurement | Immigrants from St. Vincent and the Grenadines | Lumbee |
| Minimum | $29,556 | $20,917 |
| Maximum | $132,642 | $76,919 |
| Range | $103,086 | $56,002 |
| Mean | $79,028 | $43,208 |
| Median | $79,930 | $40,857 |
| Interquartile 25% (IQ1) | $68,433 | $34,279 |
| Interquartile 75% (IQ3) | $88,913 | $51,174 |
| Interquartile Range (IQR) | $20,480 | $16,895 |
| Standard Deviation (Sample) | $20,316 | $13,998 |
| Standard Deviation (Population) | $20,174 | $13,817 |
Similar Demographics by Median Household Income
Demographics Similar to Immigrants from St. Vincent and the Grenadines by Median Household Income
In terms of median household income, the demographic groups most similar to Immigrants from St. Vincent and the Grenadines are Subsaharan African ($77,631, a difference of 0.080%), Immigrants from Middle Africa ($77,559, a difference of 0.17%), Immigrants from West Indies ($77,956, a difference of 0.34%), Mexican American Indian ($78,166, a difference of 0.61%), and Immigrants from Laos ($78,327, a difference of 0.82%).
| Demographics | Rating | Rank | Median Household Income |
| Central Americans | 1.7 /100 | #246 | Tragic $78,803 |
| Immigrants | Burma/Myanmar | 1.6 /100 | #247 | Tragic $78,682 |
| Sudanese | 1.5 /100 | #248 | Tragic $78,529 |
| West Indians | 1.4 /100 | #249 | Tragic $78,455 |
| Immigrants | Laos | 1.3 /100 | #250 | Tragic $78,327 |
| Mexican American Indians | 1.2 /100 | #251 | Tragic $78,166 |
| Immigrants | West Indies | 1.0 /100 | #252 | Tragic $77,956 |
| Immigrants | St. Vincent and the Grenadines | 0.9 /100 | #253 | Tragic $77,690 |
| Sub-Saharan Africans | 0.8 /100 | #254 | Tragic $77,631 |
| Immigrants | Middle Africa | 0.8 /100 | #255 | Tragic $77,559 |
| Belizeans | 0.6 /100 | #256 | Tragic $77,028 |
| Immigrants | Senegal | 0.5 /100 | #257 | Tragic $76,915 |
| Immigrants | Nicaragua | 0.5 /100 | #258 | Tragic $76,784 |
| Spanish American Indians | 0.4 /100 | #259 | Tragic $76,670 |
| Jamaicans | 0.4 /100 | #260 | Tragic $76,583 |
Demographics Similar to Lumbee by Median Household Income
In terms of median household income, the demographic groups most similar to Lumbee are Navajo ($59,159, a difference of 8.3%), Puerto Rican ($59,197, a difference of 8.3%), Tohono O'odham ($61,663, a difference of 12.8%), Houma ($62,575, a difference of 14.5%), and Pima ($63,262, a difference of 15.8%).
| Demographics | Rating | Rank | Median Household Income |
| Creek | 0.0 /100 | #333 | Tragic $67,715 |
| Blacks/African Americans | 0.0 /100 | #334 | Tragic $67,573 |
| Cheyenne | 0.0 /100 | #335 | Tragic $66,974 |
| Immigrants | Congo | 0.0 /100 | #336 | Tragic $66,768 |
| Kiowa | 0.0 /100 | #337 | Tragic $65,914 |
| Immigrants | Yemen | 0.0 /100 | #338 | Tragic $65,194 |
| Hopi | 0.0 /100 | #339 | Tragic $65,043 |
| Pueblo | 0.0 /100 | #340 | Tragic $64,692 |
| Crow | 0.0 /100 | #341 | Tragic $63,681 |
| Pima | 0.0 /100 | #342 | Tragic $63,262 |
| Houma | 0.0 /100 | #343 | Tragic $62,575 |
| Tohono O'odham | 0.0 /100 | #344 | Tragic $61,663 |
| Puerto Ricans | 0.0 /100 | #345 | Tragic $59,197 |
| Navajo | 0.0 /100 | #346 | Tragic $59,159 |
| Lumbee | 0.0 /100 | #347 | Tragic $54,644 |