Immigrants from Philippines vs Spaniard Median Earnings
COMPARE
Immigrants from Philippines
Spaniard
Median Earnings
Median Earnings Comparison
Immigrants from Philippines
Spaniards
$48,266
MEDIAN EARNINGS
92.9/ 100
METRIC RATING
128th/ 347
METRIC RANK
$46,059
MEDIAN EARNINGS
37.2/ 100
METRIC RATING
189th/ 347
METRIC RANK
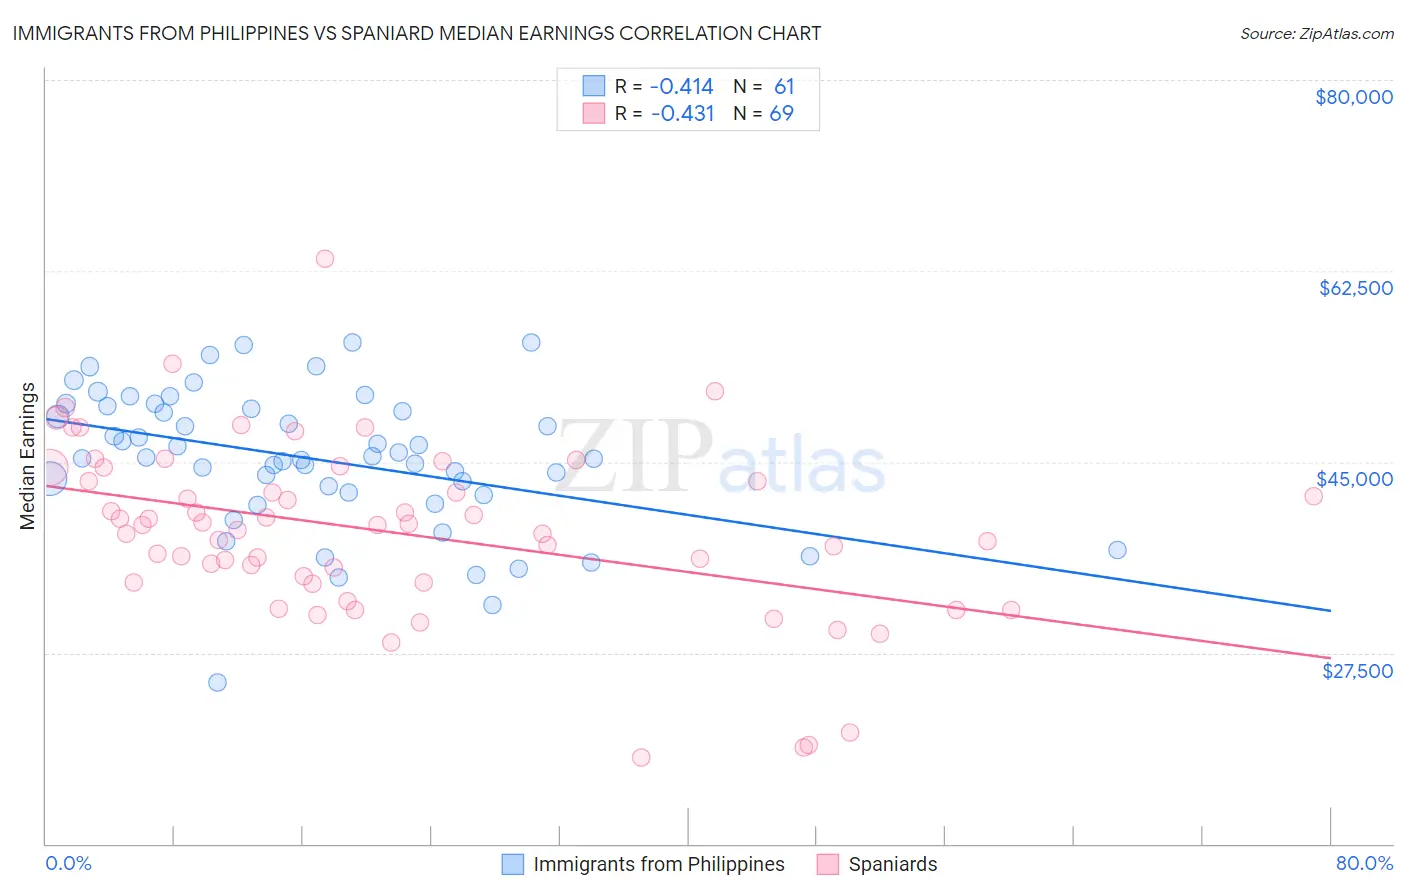
Immigrants from Philippines vs Spaniard Median Earnings Correlation Chart
The statistical analysis conducted on geographies consisting of 471,239,871 people shows a moderate negative correlation between the proportion of Immigrants from Philippines and median earnings in the United States with a correlation coefficient (R) of -0.414 and weighted average of $48,266. Similarly, the statistical analysis conducted on geographies consisting of 443,499,083 people shows a moderate negative correlation between the proportion of Spaniards and median earnings in the United States with a correlation coefficient (R) of -0.431 and weighted average of $46,059, a difference of 4.8%.
Median Earnings Correlation Summary
| Measurement | Immigrants from Philippines | Spaniard |
| Minimum | $24,776 | $17,955 |
| Maximum | $55,949 | $63,593 |
| Range | $31,173 | $45,638 |
| Mean | $45,260 | $38,549 |
| Median | $45,398 | $39,160 |
| Interquartile 25% (IQ1) | $42,071 | $33,928 |
| Interquartile 75% (IQ3) | $50,000 | $43,838 |
| Interquartile Range (IQR) | $7,929 | $9,909 |
| Standard Deviation (Sample) | $6,408 | $8,136 |
| Standard Deviation (Population) | $6,355 | $8,076 |
Similar Demographics by Median Earnings
Demographics Similar to Immigrants from Philippines by Median Earnings
In terms of median earnings, the demographic groups most similar to Immigrants from Philippines are Pakistani ($48,254, a difference of 0.020%), Sierra Leonean ($48,286, a difference of 0.040%), Immigrants from Fiji ($48,305, a difference of 0.080%), Assyrian/Chaldean/Syriac ($48,304, a difference of 0.080%), and Zimbabwean ($48,229, a difference of 0.080%).
| Demographics | Rating | Rank | Median Earnings |
| Arabs | 95.4 /100 | #121 | Exceptional $48,599 |
| Chileans | 94.8 /100 | #122 | Exceptional $48,504 |
| Immigrants | Syria | 93.9 /100 | #123 | Exceptional $48,375 |
| Brazilians | 93.7 /100 | #124 | Exceptional $48,356 |
| Immigrants | Fiji | 93.3 /100 | #125 | Exceptional $48,305 |
| Assyrians/Chaldeans/Syriacs | 93.3 /100 | #126 | Exceptional $48,304 |
| Sierra Leoneans | 93.1 /100 | #127 | Exceptional $48,286 |
| Immigrants | Philippines | 92.9 /100 | #128 | Exceptional $48,266 |
| Pakistanis | 92.8 /100 | #129 | Exceptional $48,254 |
| Zimbabweans | 92.6 /100 | #130 | Exceptional $48,229 |
| Lebanese | 92.5 /100 | #131 | Exceptional $48,226 |
| British | 92.2 /100 | #132 | Exceptional $48,189 |
| Immigrants | Uganda | 90.5 /100 | #133 | Exceptional $48,041 |
| Sri Lankans | 90.5 /100 | #134 | Exceptional $48,040 |
| Portuguese | 90.4 /100 | #135 | Exceptional $48,032 |
Demographics Similar to Spaniards by Median Earnings
In terms of median earnings, the demographic groups most similar to Spaniards are French Canadian ($46,026, a difference of 0.070%), Immigrants from Armenia ($46,094, a difference of 0.080%), Iraqi ($46,140, a difference of 0.18%), Vietnamese ($46,172, a difference of 0.24%), and Finnish ($45,940, a difference of 0.26%).
| Demographics | Rating | Rank | Median Earnings |
| Swiss | 45.9 /100 | #182 | Average $46,315 |
| French | 45.2 /100 | #183 | Average $46,296 |
| Immigrants | Kenya | 42.4 /100 | #184 | Average $46,214 |
| Uruguayans | 41.6 /100 | #185 | Average $46,190 |
| Vietnamese | 40.9 /100 | #186 | Average $46,172 |
| Iraqis | 39.9 /100 | #187 | Fair $46,140 |
| Immigrants | Armenia | 38.3 /100 | #188 | Fair $46,094 |
| Spaniards | 37.2 /100 | #189 | Fair $46,059 |
| French Canadians | 36.1 /100 | #190 | Fair $46,026 |
| Finns | 33.4 /100 | #191 | Fair $45,940 |
| Germans | 33.2 /100 | #192 | Fair $45,935 |
| Guamanians/Chamorros | 33.2 /100 | #193 | Fair $45,933 |
| Immigrants | Costa Rica | 33.0 /100 | #194 | Fair $45,928 |
| Immigrants | St. Vincent and the Grenadines | 32.4 /100 | #195 | Fair $45,908 |
| Yugoslavians | 30.5 /100 | #196 | Fair $45,846 |