Immigrants from Ethiopia vs South American Indian Householder Income Ages 25 - 44 years
COMPARE
Immigrants from Ethiopia
South American Indian
Householder Income Ages 25 - 44 years
Householder Income Ages 25 - 44 years Comparison
Immigrants from Ethiopia
South American Indians
$95,256
HOUSEHOLDER INCOME AGES 25 - 44 YEARS
59.5/ 100
METRIC RATING
166th/ 347
METRIC RANK
$96,497
HOUSEHOLDER INCOME AGES 25 - 44 YEARS
74.5/ 100
METRIC RATING
152nd/ 347
METRIC RANK
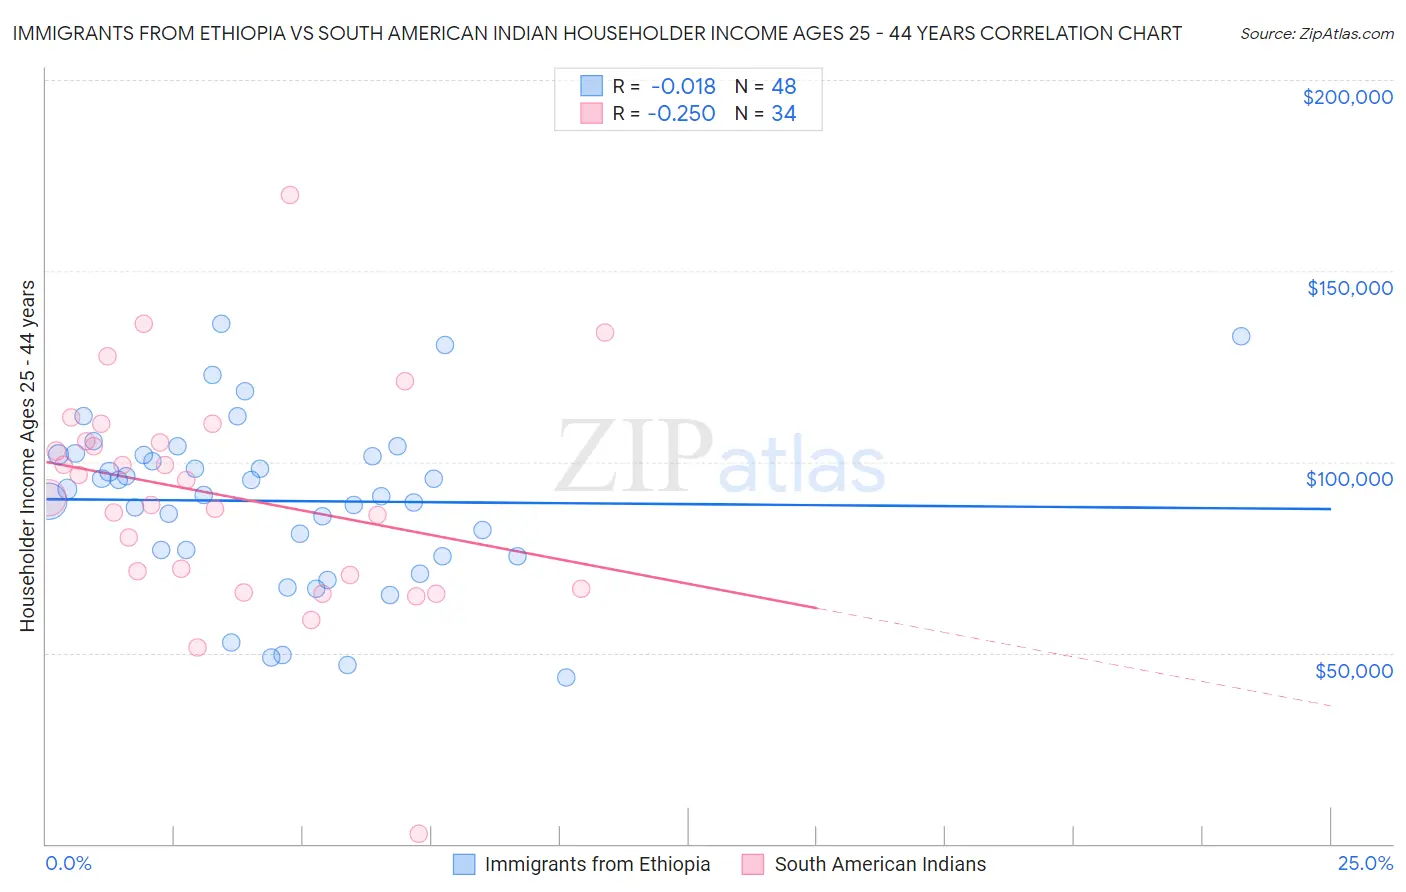
Immigrants from Ethiopia vs South American Indian Householder Income Ages 25 - 44 years Correlation Chart
The statistical analysis conducted on geographies consisting of 211,298,235 people shows no correlation between the proportion of Immigrants from Ethiopia and household income with householder between the ages 25 and 44 in the United States with a correlation coefficient (R) of -0.018 and weighted average of $95,256. Similarly, the statistical analysis conducted on geographies consisting of 164,455,741 people shows a weak negative correlation between the proportion of South American Indians and household income with householder between the ages 25 and 44 in the United States with a correlation coefficient (R) of -0.250 and weighted average of $96,497, a difference of 1.3%.
Householder Income Ages 25 - 44 years Correlation Summary
| Measurement | Immigrants from Ethiopia | South American Indian |
| Minimum | $43,552 | $2,499 |
| Maximum | $136,169 | $170,036 |
| Range | $92,617 | $167,537 |
| Mean | $89,756 | $91,221 |
| Median | $92,049 | $92,899 |
| Interquartile 25% (IQ1) | $76,125 | $70,385 |
| Interquartile 75% (IQ3) | $101,763 | $105,466 |
| Interquartile Range (IQR) | $25,638 | $35,081 |
| Standard Deviation (Sample) | $21,797 | $29,879 |
| Standard Deviation (Population) | $21,568 | $29,437 |
Demographics Similar to Immigrants from Ethiopia and South American Indians by Householder Income Ages 25 - 44 years
In terms of householder income ages 25 - 44 years, the demographic groups most similar to Immigrants from Ethiopia are Immigrants from Nepal ($95,322, a difference of 0.070%), South American ($95,362, a difference of 0.11%), Immigrants from Saudi Arabia ($95,450, a difference of 0.20%), Czechoslovakian ($95,070, a difference of 0.20%), and Alsatian ($95,059, a difference of 0.21%). Similarly, the demographic groups most similar to South American Indians are Czech ($96,525, a difference of 0.030%), Slovene ($96,439, a difference of 0.060%), Slavic ($96,377, a difference of 0.12%), Ugandan ($96,667, a difference of 0.18%), and Basque ($96,709, a difference of 0.22%).
| Demographics | Rating | Rank | Householder Income Ages 25 - 44 years |
| Basques | 76.6 /100 | #149 | Good $96,709 |
| Ugandans | 76.2 /100 | #150 | Good $96,667 |
| Czechs | 74.8 /100 | #151 | Good $96,525 |
| South American Indians | 74.5 /100 | #152 | Good $96,497 |
| Slovenes | 73.9 /100 | #153 | Good $96,439 |
| Slavs | 73.2 /100 | #154 | Good $96,377 |
| Moroccans | 70.3 /100 | #155 | Good $96,117 |
| Immigrants | Germany | 67.9 /100 | #156 | Good $95,913 |
| Immigrants | Uganda | 65.2 /100 | #157 | Good $95,698 |
| Scandinavians | 63.9 /100 | #158 | Good $95,596 |
| Costa Ricans | 63.5 /100 | #159 | Good $95,565 |
| Icelanders | 63.4 /100 | #160 | Good $95,560 |
| Immigrants | Portugal | 62.8 /100 | #161 | Good $95,512 |
| Swiss | 62.8 /100 | #162 | Good $95,511 |
| Immigrants | Saudi Arabia | 62.0 /100 | #163 | Good $95,450 |
| South Americans | 60.9 /100 | #164 | Good $95,362 |
| Immigrants | Nepal | 60.3 /100 | #165 | Good $95,322 |
| Immigrants | Ethiopia | 59.5 /100 | #166 | Average $95,256 |
| Czechoslovakians | 57.0 /100 | #167 | Average $95,070 |
| Alsatians | 56.8 /100 | #168 | Average $95,059 |
| Native Hawaiians | 56.8 /100 | #169 | Average $95,058 |