Pennsylvania German vs Immigrants from Kenya Median Male Earnings
COMPARE
Pennsylvania German
Immigrants from Kenya
Median Male Earnings
Median Male Earnings Comparison
Pennsylvania Germans
Immigrants from Kenya
$50,878
MEDIAN MALE EARNINGS
2.8/ 100
METRIC RATING
236th/ 347
METRIC RANK
$53,427
MEDIAN MALE EARNINGS
26.0/ 100
METRIC RATING
197th/ 347
METRIC RANK
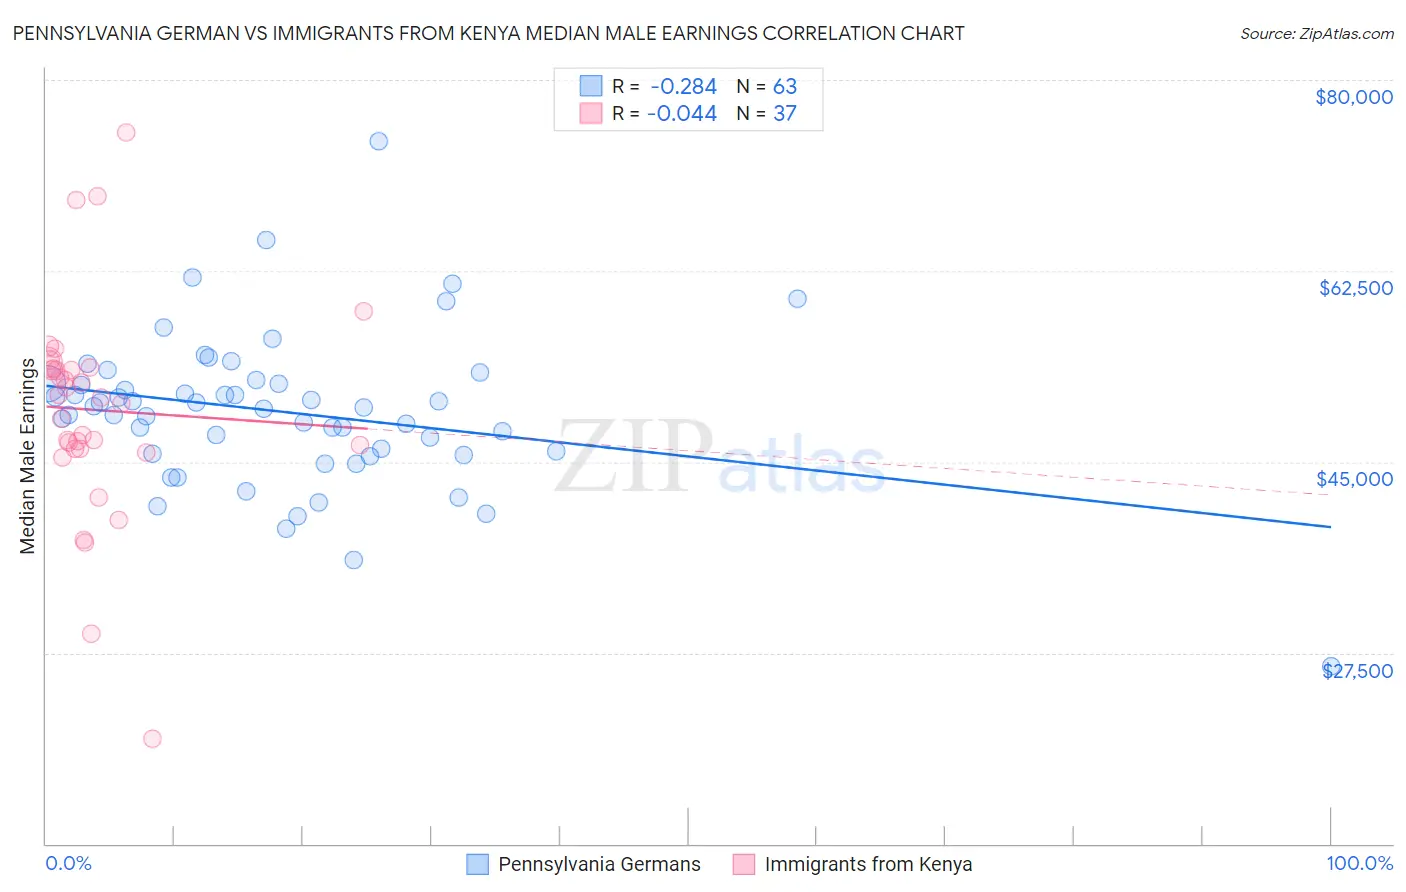
Pennsylvania German vs Immigrants from Kenya Median Male Earnings Correlation Chart
The statistical analysis conducted on geographies consisting of 233,999,386 people shows a weak negative correlation between the proportion of Pennsylvania Germans and median male earnings in the United States with a correlation coefficient (R) of -0.284 and weighted average of $50,878. Similarly, the statistical analysis conducted on geographies consisting of 218,068,139 people shows no correlation between the proportion of Immigrants from Kenya and median male earnings in the United States with a correlation coefficient (R) of -0.044 and weighted average of $53,427, a difference of 5.0%.
Median Male Earnings Correlation Summary
| Measurement | Pennsylvania German | Immigrants from Kenya |
| Minimum | $26,250 | $19,659 |
| Maximum | $74,375 | $75,179 |
| Range | $48,125 | $55,520 |
| Mean | $49,588 | $49,751 |
| Median | $50,000 | $50,930 |
| Interquartile 25% (IQ1) | $45,795 | $46,171 |
| Interquartile 75% (IQ3) | $52,150 | $53,573 |
| Interquartile Range (IQR) | $6,355 | $7,402 |
| Standard Deviation (Sample) | $7,111 | $9,966 |
| Standard Deviation (Population) | $7,054 | $9,831 |
Similar Demographics by Median Male Earnings
Demographics Similar to Pennsylvania Germans by Median Male Earnings
In terms of median male earnings, the demographic groups most similar to Pennsylvania Germans are Immigrants from Western Africa ($50,940, a difference of 0.12%), Immigrants from Barbados ($50,795, a difference of 0.16%), Malaysian ($50,772, a difference of 0.21%), American ($50,761, a difference of 0.23%), and West Indian ($50,682, a difference of 0.39%).
| Demographics | Rating | Rank | Median Male Earnings |
| Immigrants | Trinidad and Tobago | 4.5 /100 | #229 | Tragic $51,376 |
| Immigrants | Nigeria | 4.2 /100 | #230 | Tragic $51,310 |
| Barbadians | 3.9 /100 | #231 | Tragic $51,236 |
| Sudanese | 3.9 /100 | #232 | Tragic $51,216 |
| Aleuts | 3.7 /100 | #233 | Tragic $51,168 |
| Cape Verdeans | 3.5 /100 | #234 | Tragic $51,103 |
| Immigrants | Western Africa | 3.0 /100 | #235 | Tragic $50,940 |
| Pennsylvania Germans | 2.8 /100 | #236 | Tragic $50,878 |
| Immigrants | Barbados | 2.6 /100 | #237 | Tragic $50,795 |
| Malaysians | 2.5 /100 | #238 | Tragic $50,772 |
| Americans | 2.5 /100 | #239 | Tragic $50,761 |
| West Indians | 2.3 /100 | #240 | Tragic $50,682 |
| Immigrants | St. Vincent and the Grenadines | 2.3 /100 | #241 | Tragic $50,665 |
| Guyanese | 2.2 /100 | #242 | Tragic $50,613 |
| French American Indians | 2.2 /100 | #243 | Tragic $50,611 |
Demographics Similar to Immigrants from Kenya by Median Male Earnings
In terms of median male earnings, the demographic groups most similar to Immigrants from Kenya are Immigrants from Africa ($53,457, a difference of 0.060%), Immigrants from the Azores ($53,503, a difference of 0.14%), Spanish ($53,576, a difference of 0.28%), Immigrants from Costa Rica ($53,237, a difference of 0.36%), and Tongan ($53,218, a difference of 0.39%).
| Demographics | Rating | Rank | Median Male Earnings |
| Uruguayans | 31.1 /100 | #190 | Fair $53,680 |
| Guamanians/Chamorros | 30.7 /100 | #191 | Fair $53,661 |
| Scotch-Irish | 30.6 /100 | #192 | Fair $53,658 |
| Kenyans | 30.4 /100 | #193 | Fair $53,647 |
| Spanish | 29.0 /100 | #194 | Fair $53,576 |
| Immigrants | Azores | 27.5 /100 | #195 | Fair $53,503 |
| Immigrants | Africa | 26.6 /100 | #196 | Fair $53,457 |
| Immigrants | Kenya | 26.0 /100 | #197 | Fair $53,427 |
| Immigrants | Costa Rica | 22.6 /100 | #198 | Fair $53,237 |
| Tongans | 22.3 /100 | #199 | Fair $53,218 |
| Immigrants | Thailand | 17.5 /100 | #200 | Poor $52,908 |
| Immigrants | Bosnia and Herzegovina | 16.9 /100 | #201 | Poor $52,869 |
| Immigrants | Uruguay | 16.8 /100 | #202 | Poor $52,860 |
| Panamanians | 16.5 /100 | #203 | Poor $52,835 |
| Ghanaians | 16.1 /100 | #204 | Poor $52,810 |