Tongan vs Iroquois Median Family Income
COMPARE
Tongan
Iroquois
Median Family Income
Median Family Income Comparison
Tongans
Iroquois
$105,967
MEDIAN FAMILY INCOME
84.3/ 100
METRIC RATING
143rd/ 347
METRIC RANK
$90,543
MEDIAN FAMILY INCOME
0.2/ 100
METRIC RATING
271st/ 347
METRIC RANK
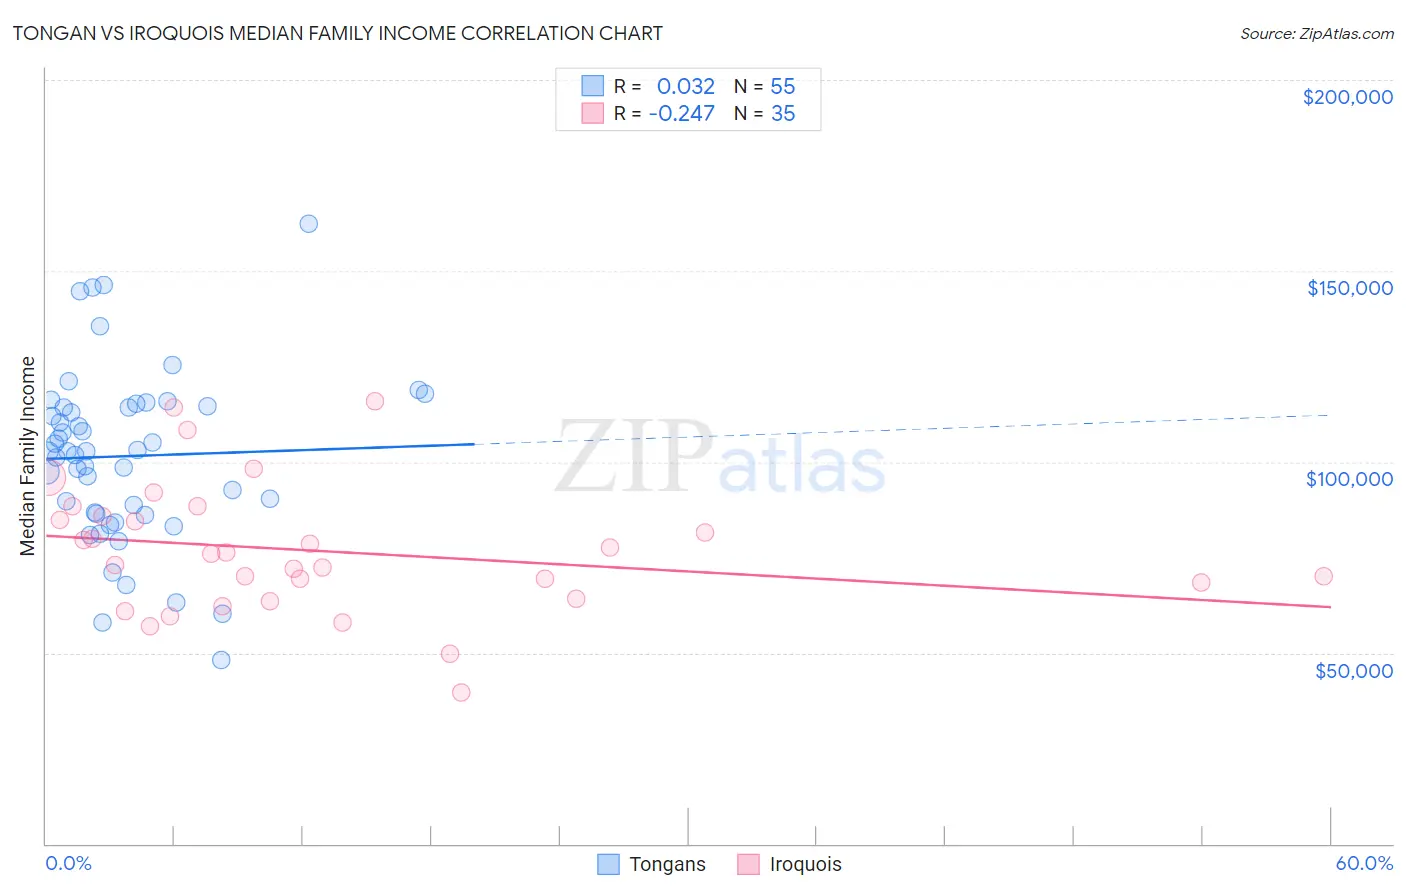
Tongan vs Iroquois Median Family Income Correlation Chart
The statistical analysis conducted on geographies consisting of 102,775,236 people shows no correlation between the proportion of Tongans and median family income in the United States with a correlation coefficient (R) of 0.032 and weighted average of $105,967. Similarly, the statistical analysis conducted on geographies consisting of 207,203,022 people shows a weak negative correlation between the proportion of Iroquois and median family income in the United States with a correlation coefficient (R) of -0.247 and weighted average of $90,543, a difference of 17.0%.
Median Family Income Correlation Summary
| Measurement | Tongan | Iroquois |
| Minimum | $48,125 | $39,479 |
| Maximum | $162,500 | $115,891 |
| Range | $114,375 | $76,412 |
| Mean | $101,505 | $76,689 |
| Median | $102,675 | $75,795 |
| Interquartile 25% (IQ1) | $86,338 | $64,141 |
| Interquartile 75% (IQ3) | $114,438 | $85,646 |
| Interquartile Range (IQR) | $28,100 | $21,505 |
| Standard Deviation (Sample) | $22,609 | $16,973 |
| Standard Deviation (Population) | $22,402 | $16,729 |
Similar Demographics by Median Family Income
Demographics Similar to Tongans by Median Family Income
In terms of median family income, the demographic groups most similar to Tongans are Immigrants from Morocco ($105,964, a difference of 0.0%), Slovene ($106,020, a difference of 0.050%), Danish ($105,900, a difference of 0.060%), Czech ($105,839, a difference of 0.12%), and Immigrants from Syria ($106,118, a difference of 0.14%).
| Demographics | Rating | Rank | Median Family Income |
| Immigrants | South Eastern Asia | 86.1 /100 | #136 | Excellent $106,252 |
| Immigrants | Uganda | 85.7 /100 | #137 | Excellent $106,188 |
| Immigrants | Vietnam | 85.7 /100 | #138 | Excellent $106,186 |
| Luxembourgers | 85.7 /100 | #139 | Excellent $106,183 |
| Norwegians | 85.5 /100 | #140 | Excellent $106,144 |
| Immigrants | Syria | 85.3 /100 | #141 | Excellent $106,118 |
| Slovenes | 84.7 /100 | #142 | Excellent $106,020 |
| Tongans | 84.3 /100 | #143 | Excellent $105,967 |
| Immigrants | Morocco | 84.3 /100 | #144 | Excellent $105,964 |
| Danes | 83.8 /100 | #145 | Excellent $105,900 |
| Czechs | 83.4 /100 | #146 | Excellent $105,839 |
| Immigrants | Chile | 82.1 /100 | #147 | Excellent $105,655 |
| Hungarians | 81.7 /100 | #148 | Excellent $105,609 |
| Immigrants | Germany | 80.9 /100 | #149 | Excellent $105,507 |
| Irish | 80.5 /100 | #150 | Excellent $105,453 |
Demographics Similar to Iroquois by Median Family Income
In terms of median family income, the demographic groups most similar to Iroquois are Jamaican ($90,581, a difference of 0.040%), Immigrants from Liberia ($90,450, a difference of 0.10%), Immigrants from Micronesia ($90,345, a difference of 0.22%), Spanish American ($90,322, a difference of 0.24%), and Cree ($90,882, a difference of 0.37%).
| Demographics | Rating | Rank | Median Family Income |
| Senegalese | 0.3 /100 | #264 | Tragic $91,475 |
| Hmong | 0.3 /100 | #265 | Tragic $91,296 |
| Central Americans | 0.3 /100 | #266 | Tragic $91,087 |
| Mexican American Indians | 0.2 /100 | #267 | Tragic $90,918 |
| Cree | 0.2 /100 | #268 | Tragic $90,882 |
| Belizeans | 0.2 /100 | #269 | Tragic $90,880 |
| Jamaicans | 0.2 /100 | #270 | Tragic $90,581 |
| Iroquois | 0.2 /100 | #271 | Tragic $90,543 |
| Immigrants | Liberia | 0.2 /100 | #272 | Tragic $90,450 |
| Immigrants | Micronesia | 0.2 /100 | #273 | Tragic $90,345 |
| Spanish Americans | 0.2 /100 | #274 | Tragic $90,322 |
| Immigrants | St. Vincent and the Grenadines | 0.2 /100 | #275 | Tragic $90,094 |
| Immigrants | Zaire | 0.1 /100 | #276 | Tragic $89,285 |
| Immigrants | Jamaica | 0.1 /100 | #277 | Tragic $89,268 |
| Immigrants | Grenada | 0.1 /100 | #278 | Tragic $89,249 |