Immigrants from Eastern Europe vs Immigrants from Liberia Median Earnings
COMPARE
Immigrants from Eastern Europe
Immigrants from Liberia
Median Earnings
Median Earnings Comparison
Immigrants from Eastern Europe
Immigrants from Liberia
$51,624
MEDIAN EARNINGS
99.9/ 100
METRIC RATING
57th/ 347
METRIC RANK
$42,923
MEDIAN EARNINGS
0.7/ 100
METRIC RATING
264th/ 347
METRIC RANK
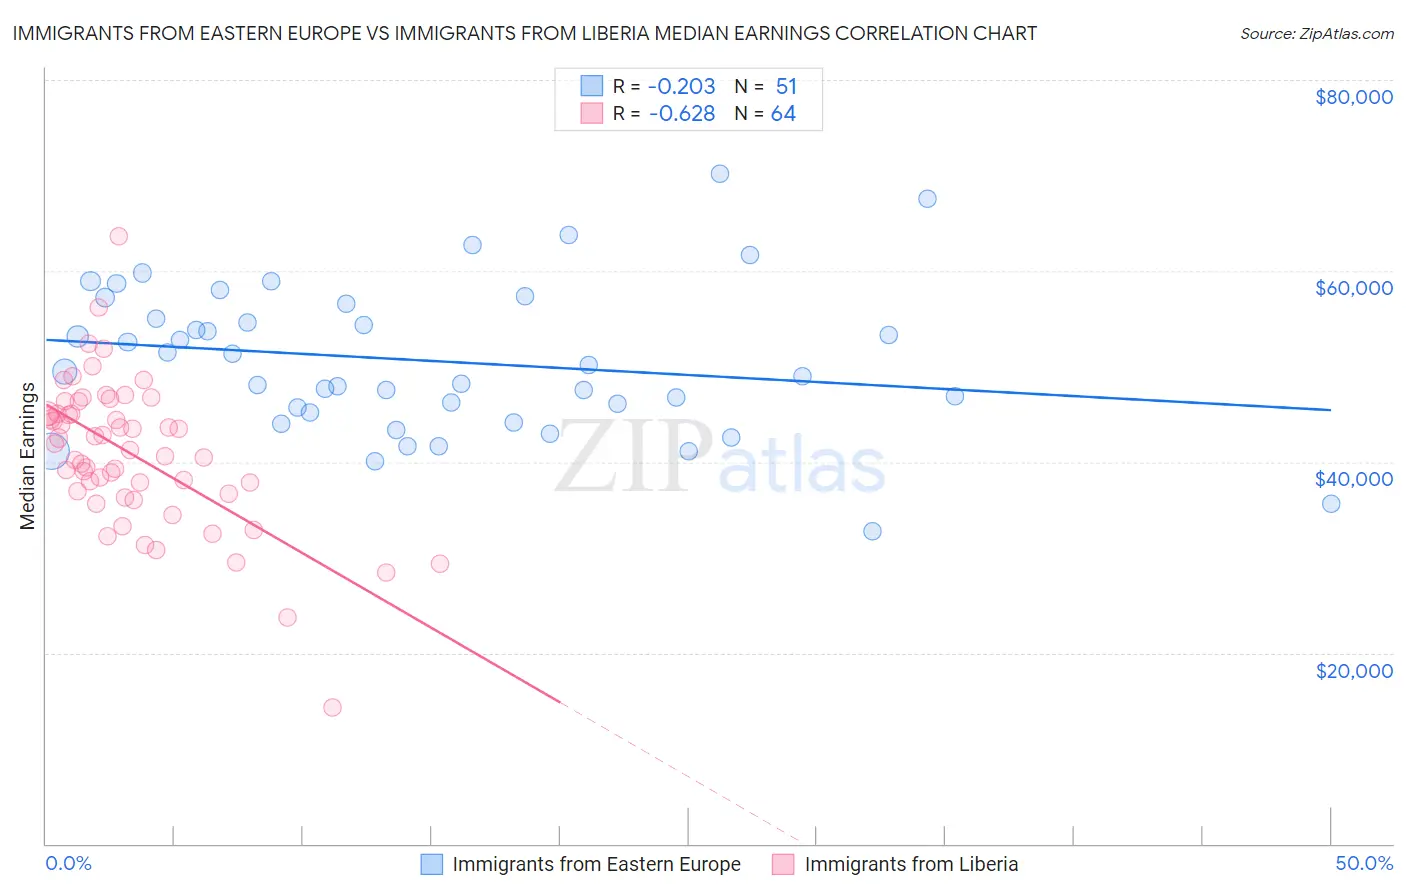
Immigrants from Eastern Europe vs Immigrants from Liberia Median Earnings Correlation Chart
The statistical analysis conducted on geographies consisting of 475,833,062 people shows a weak negative correlation between the proportion of Immigrants from Eastern Europe and median earnings in the United States with a correlation coefficient (R) of -0.203 and weighted average of $51,624. Similarly, the statistical analysis conducted on geographies consisting of 135,295,960 people shows a significant negative correlation between the proportion of Immigrants from Liberia and median earnings in the United States with a correlation coefficient (R) of -0.628 and weighted average of $42,923, a difference of 20.3%.
Median Earnings Correlation Summary
| Measurement | Immigrants from Eastern Europe | Immigrants from Liberia |
| Minimum | $32,703 | $14,336 |
| Maximum | $70,148 | $63,608 |
| Range | $37,445 | $49,272 |
| Mean | $50,592 | $40,857 |
| Median | $49,479 | $41,575 |
| Interquartile 25% (IQ1) | $45,140 | $36,787 |
| Interquartile 75% (IQ3) | $56,614 | $45,056 |
| Interquartile Range (IQR) | $11,474 | $8,269 |
| Standard Deviation (Sample) | $7,882 | $7,722 |
| Standard Deviation (Population) | $7,805 | $7,661 |
Similar Demographics by Median Earnings
Demographics Similar to Immigrants from Eastern Europe by Median Earnings
In terms of median earnings, the demographic groups most similar to Immigrants from Eastern Europe are Immigrants from Bolivia ($51,605, a difference of 0.040%), Immigrants from Croatia ($51,581, a difference of 0.080%), Immigrants from Pakistan ($51,693, a difference of 0.13%), Immigrants from Serbia ($51,557, a difference of 0.13%), and Immigrants from Latvia ($51,555, a difference of 0.13%).
| Demographics | Rating | Rank | Median Earnings |
| Immigrants | South Africa | 100.0 /100 | #50 | Exceptional $51,850 |
| Immigrants | Austria | 99.9 /100 | #51 | Exceptional $51,826 |
| Estonians | 99.9 /100 | #52 | Exceptional $51,772 |
| Immigrants | Norway | 99.9 /100 | #53 | Exceptional $51,758 |
| Immigrants | Indonesia | 99.9 /100 | #54 | Exceptional $51,715 |
| Egyptians | 99.9 /100 | #55 | Exceptional $51,701 |
| Immigrants | Pakistan | 99.9 /100 | #56 | Exceptional $51,693 |
| Immigrants | Eastern Europe | 99.9 /100 | #57 | Exceptional $51,624 |
| Immigrants | Bolivia | 99.9 /100 | #58 | Exceptional $51,605 |
| Immigrants | Croatia | 99.9 /100 | #59 | Exceptional $51,581 |
| Immigrants | Serbia | 99.9 /100 | #60 | Exceptional $51,557 |
| Immigrants | Latvia | 99.9 /100 | #61 | Exceptional $51,555 |
| Immigrants | Romania | 99.9 /100 | #62 | Exceptional $51,337 |
| Immigrants | Bulgaria | 99.9 /100 | #63 | Exceptional $51,318 |
| New Zealanders | 99.9 /100 | #64 | Exceptional $51,246 |
Demographics Similar to Immigrants from Liberia by Median Earnings
In terms of median earnings, the demographic groups most similar to Immigrants from Liberia are Salvadoran ($42,912, a difference of 0.030%), Immigrants from Laos ($42,884, a difference of 0.090%), Inupiat ($43,000, a difference of 0.18%), Immigrants from Jamaica ($43,026, a difference of 0.24%), and Nicaraguan ($43,026, a difference of 0.24%).
| Demographics | Rating | Rank | Median Earnings |
| Jamaicans | 1.3 /100 | #257 | Tragic $43,343 |
| French American Indians | 1.3 /100 | #258 | Tragic $43,333 |
| German Russians | 1.1 /100 | #259 | Tragic $43,200 |
| Immigrants | Somalia | 0.9 /100 | #260 | Tragic $43,100 |
| Immigrants | Jamaica | 0.8 /100 | #261 | Tragic $43,026 |
| Nicaraguans | 0.8 /100 | #262 | Tragic $43,026 |
| Inupiat | 0.8 /100 | #263 | Tragic $43,000 |
| Immigrants | Liberia | 0.7 /100 | #264 | Tragic $42,923 |
| Salvadorans | 0.7 /100 | #265 | Tragic $42,912 |
| Immigrants | Laos | 0.7 /100 | #266 | Tragic $42,884 |
| Cree | 0.6 /100 | #267 | Tragic $42,777 |
| Americans | 0.6 /100 | #268 | Tragic $42,742 |
| Belizeans | 0.5 /100 | #269 | Tragic $42,702 |
| Osage | 0.5 /100 | #270 | Tragic $42,651 |
| Pennsylvania Germans | 0.5 /100 | #271 | Tragic $42,615 |