Marshallese vs Immigrants from Jamaica Householder Income Under 25 years
COMPARE
Marshallese
Immigrants from Jamaica
Householder Income Under 25 years
Householder Income Under 25 years Comparison
Marshallese
Immigrants from Jamaica
$50,627
HOUSEHOLDER INCOME UNDER 25 YEARS
2.1/ 100
METRIC RATING
244th/ 347
METRIC RANK
$51,038
HOUSEHOLDER INCOME UNDER 25 YEARS
5.6/ 100
METRIC RATING
225th/ 347
METRIC RANK
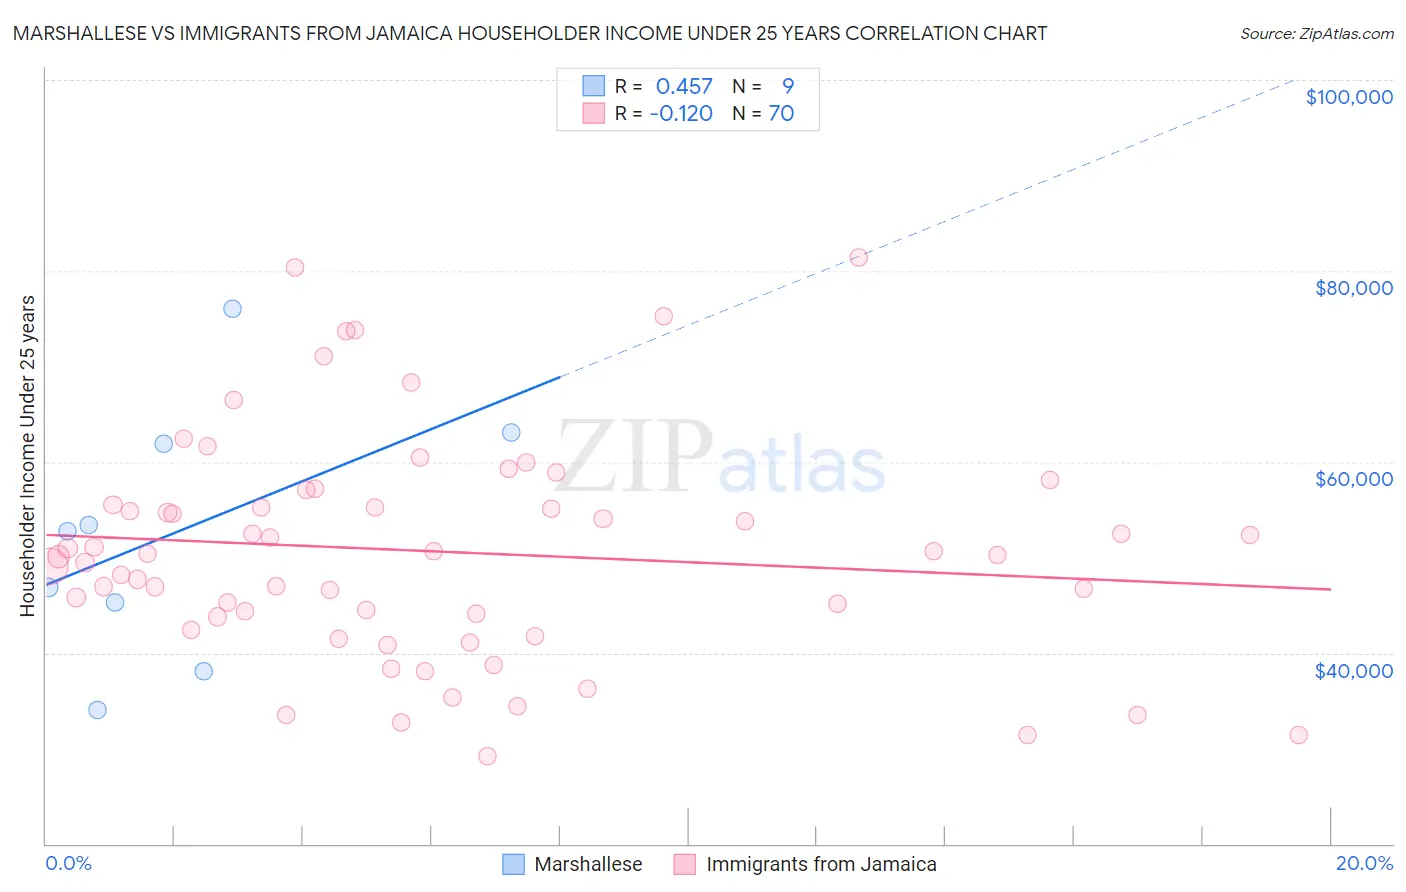
Marshallese vs Immigrants from Jamaica Householder Income Under 25 years Correlation Chart
The statistical analysis conducted on geographies consisting of 14,161,929 people shows a moderate positive correlation between the proportion of Marshallese and household income with householder under the age of 25 in the United States with a correlation coefficient (R) of 0.457 and weighted average of $50,627. Similarly, the statistical analysis conducted on geographies consisting of 257,803,816 people shows a poor negative correlation between the proportion of Immigrants from Jamaica and household income with householder under the age of 25 in the United States with a correlation coefficient (R) of -0.120 and weighted average of $51,038, a difference of 0.81%.
Householder Income Under 25 years Correlation Summary
| Measurement | Marshallese | Immigrants from Jamaica |
| Minimum | $33,972 | $29,211 |
| Maximum | $76,023 | $81,354 |
| Range | $42,051 | $52,143 |
| Mean | $52,361 | $50,619 |
| Median | $52,698 | $50,278 |
| Interquartile 25% (IQ1) | $41,668 | $43,769 |
| Interquartile 75% (IQ3) | $62,476 | $55,499 |
| Interquartile Range (IQR) | $20,807 | $11,730 |
| Standard Deviation (Sample) | $13,175 | $11,678 |
| Standard Deviation (Population) | $12,421 | $11,594 |
Demographics Similar to Marshallese and Immigrants from Jamaica by Householder Income Under 25 years
In terms of householder income under 25 years, the demographic groups most similar to Marshallese are Immigrants from Thailand ($50,645, a difference of 0.040%), Cuban ($50,655, a difference of 0.060%), Immigrants from Micronesia ($50,691, a difference of 0.12%), Immigrants from Lebanon ($50,729, a difference of 0.20%), and Immigrants from Caribbean ($50,757, a difference of 0.26%). Similarly, the demographic groups most similar to Immigrants from Jamaica are Yugoslavian ($51,028, a difference of 0.020%), Immigrants from Central America ($51,022, a difference of 0.030%), Belizean ($51,094, a difference of 0.11%), Immigrants from Norway ($50,984, a difference of 0.11%), and Yuman ($50,933, a difference of 0.21%).
| Demographics | Rating | Rank | Householder Income Under 25 years |
| Belizeans | 6.4 /100 | #224 | Tragic $51,094 |
| Immigrants | Jamaica | 5.6 /100 | #225 | Tragic $51,038 |
| Yugoslavians | 5.5 /100 | #226 | Tragic $51,028 |
| Immigrants | Central America | 5.4 /100 | #227 | Tragic $51,022 |
| Immigrants | Norway | 5.0 /100 | #228 | Tragic $50,984 |
| Yuman | 4.4 /100 | #229 | Tragic $50,933 |
| Jamaicans | 4.4 /100 | #230 | Tragic $50,929 |
| Ugandans | 4.3 /100 | #231 | Tragic $50,923 |
| Slovenes | 4.0 /100 | #232 | Tragic $50,886 |
| Pennsylvania Germans | 3.7 /100 | #233 | Tragic $50,852 |
| Kenyans | 3.3 /100 | #234 | Tragic $50,815 |
| Spanish | 3.3 /100 | #235 | Tragic $50,813 |
| English | 3.3 /100 | #236 | Tragic $50,805 |
| Germans | 3.3 /100 | #237 | Tragic $50,804 |
| Iraqis | 3.2 /100 | #238 | Tragic $50,802 |
| Immigrants | Caribbean | 2.9 /100 | #239 | Tragic $50,757 |
| Immigrants | Lebanon | 2.7 /100 | #240 | Tragic $50,729 |
| Immigrants | Micronesia | 2.5 /100 | #241 | Tragic $50,691 |
| Cubans | 2.3 /100 | #242 | Tragic $50,655 |
| Immigrants | Thailand | 2.2 /100 | #243 | Tragic $50,645 |
| Marshallese | 2.1 /100 | #244 | Tragic $50,627 |