Immigrants from Denmark vs Celtic 11th Grade
COMPARE
Immigrants from Denmark
Celtic
11th Grade
11th Grade Comparison
Immigrants from Denmark
Celtics
93.7%
11TH GRADE
99.5/ 100
METRIC RATING
79th/ 347
METRIC RANK
93.7%
11TH GRADE
99.5/ 100
METRIC RATING
76th/ 347
METRIC RANK
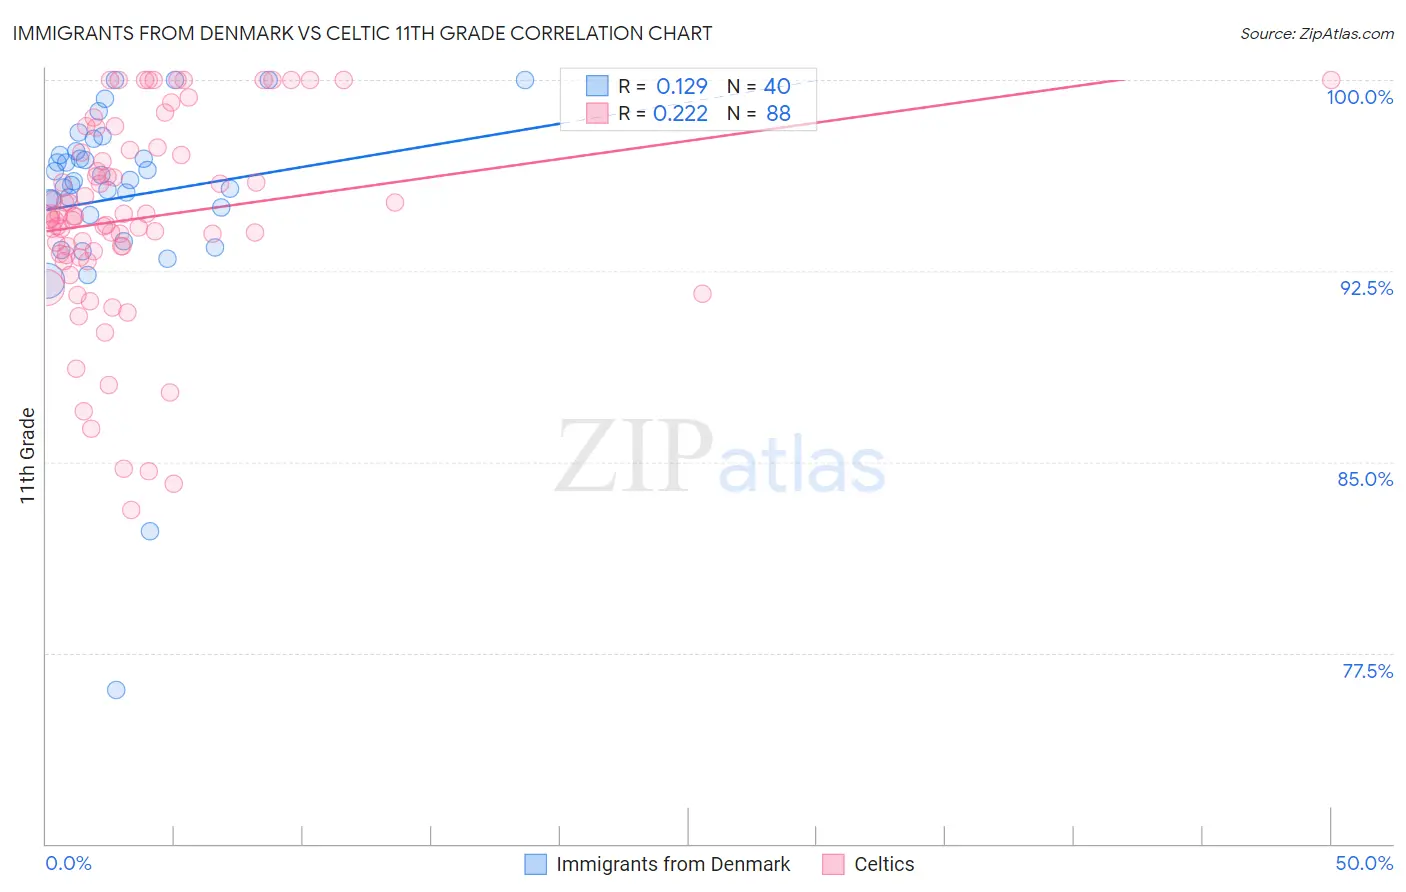
Immigrants from Denmark vs Celtic 11th Grade Correlation Chart
The statistical analysis conducted on geographies consisting of 136,430,715 people shows a poor positive correlation between the proportion of Immigrants from Denmark and percentage of population with at least 11th grade education in the United States with a correlation coefficient (R) of 0.129 and weighted average of 93.7%. Similarly, the statistical analysis conducted on geographies consisting of 168,876,981 people shows a weak positive correlation between the proportion of Celtics and percentage of population with at least 11th grade education in the United States with a correlation coefficient (R) of 0.222 and weighted average of 93.7%, a difference of 0.010%.
11th Grade Correlation Summary
| Measurement | Immigrants from Denmark | Celtic |
| Minimum | 76.1% | 83.1% |
| Maximum | 100.0% | 100.0% |
| Range | 23.9% | 16.9% |
| Mean | 95.4% | 94.6% |
| Median | 96.0% | 94.6% |
| Interquartile 25% (IQ1) | 94.8% | 93.2% |
| Interquartile 75% (IQ3) | 97.1% | 97.2% |
| Interquartile Range (IQR) | 2.3% | 4.0% |
| Standard Deviation (Sample) | 4.4% | 4.0% |
| Standard Deviation (Population) | 4.3% | 3.9% |
Demographics Similar to Immigrants from Denmark and Celtics by 11th Grade
In terms of 11th grade, the demographic groups most similar to Immigrants from Denmark are Aleut (93.7%, a difference of 0.010%), Soviet Union (93.7%, a difference of 0.010%), Canadian (93.7%, a difference of 0.020%), Immigrants from Moldova (93.7%, a difference of 0.020%), and Immigrants from Latvia (93.8%, a difference of 0.040%). Similarly, the demographic groups most similar to Celtics are Aleut (93.7%, a difference of 0.0%), Soviet Union (93.7%, a difference of 0.010%), Immigrants from Latvia (93.8%, a difference of 0.030%), Canadian (93.7%, a difference of 0.030%), and Immigrants from Moldova (93.7%, a difference of 0.040%).
| Demographics | Rating | Rank | 11th Grade |
| Immigrants | Netherlands | 99.8 /100 | #67 | Exceptional 93.9% |
| Zimbabweans | 99.8 /100 | #68 | Exceptional 93.9% |
| Scotch-Irish | 99.8 /100 | #69 | Exceptional 93.9% |
| Immigrants | England | 99.7 /100 | #70 | Exceptional 93.8% |
| Immigrants | South Africa | 99.7 /100 | #71 | Exceptional 93.8% |
| Immigrants | Japan | 99.7 /100 | #72 | Exceptional 93.8% |
| Romanians | 99.6 /100 | #73 | Exceptional 93.8% |
| Immigrants | Czechoslovakia | 99.6 /100 | #74 | Exceptional 93.8% |
| Immigrants | Latvia | 99.6 /100 | #75 | Exceptional 93.8% |
| Celtics | 99.5 /100 | #76 | Exceptional 93.7% |
| Aleuts | 99.5 /100 | #77 | Exceptional 93.7% |
| Soviet Union | 99.5 /100 | #78 | Exceptional 93.7% |
| Immigrants | Denmark | 99.5 /100 | #79 | Exceptional 93.7% |
| Canadians | 99.5 /100 | #80 | Exceptional 93.7% |
| Immigrants | Moldova | 99.5 /100 | #81 | Exceptional 93.7% |
| Immigrants | Saudi Arabia | 99.3 /100 | #82 | Exceptional 93.7% |
| Icelanders | 99.3 /100 | #83 | Exceptional 93.6% |
| Immigrants | Taiwan | 99.3 /100 | #84 | Exceptional 93.6% |
| Immigrants | Switzerland | 99.3 /100 | #85 | Exceptional 93.6% |
| Immigrants | South Central Asia | 99.2 /100 | #86 | Exceptional 93.6% |
| Immigrants | Western Europe | 99.2 /100 | #87 | Exceptional 93.6% |