Immigrants from Czechoslovakia vs Immigrants from Malaysia Per Capita Income
COMPARE
Immigrants from Czechoslovakia
Immigrants from Malaysia
Per Capita Income
Per Capita Income Comparison
Immigrants from Czechoslovakia
Immigrants from Malaysia
$51,770
PER CAPITA INCOME
100.0/ 100
METRIC RATING
38th/ 347
METRIC RANK
$49,983
PER CAPITA INCOME
99.9/ 100
METRIC RATING
58th/ 347
METRIC RANK
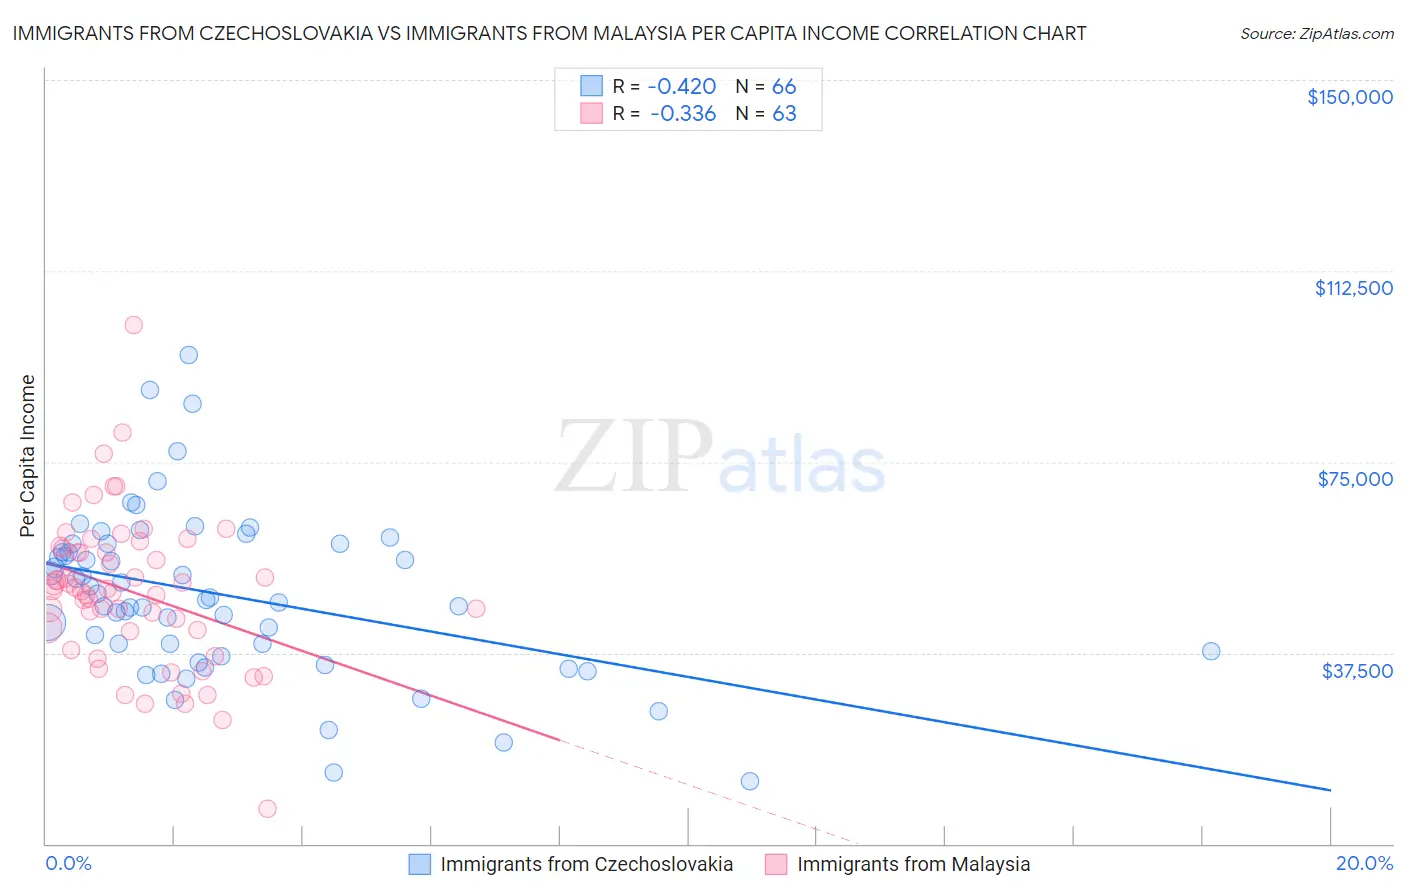
Immigrants from Czechoslovakia vs Immigrants from Malaysia Per Capita Income Correlation Chart
The statistical analysis conducted on geographies consisting of 195,456,516 people shows a moderate negative correlation between the proportion of Immigrants from Czechoslovakia and per capita income in the United States with a correlation coefficient (R) of -0.420 and weighted average of $51,770. Similarly, the statistical analysis conducted on geographies consisting of 197,965,011 people shows a mild negative correlation between the proportion of Immigrants from Malaysia and per capita income in the United States with a correlation coefficient (R) of -0.336 and weighted average of $49,983, a difference of 3.6%.
Per Capita Income Correlation Summary
| Measurement | Immigrants from Czechoslovakia | Immigrants from Malaysia |
| Minimum | $12,340 | $6,770 |
| Maximum | $95,878 | $101,760 |
| Range | $83,538 | $94,990 |
| Mean | $48,860 | $49,426 |
| Median | $48,155 | $49,924 |
| Interquartile 25% (IQ1) | $37,887 | $41,735 |
| Interquartile 75% (IQ3) | $58,814 | $57,884 |
| Interquartile Range (IQR) | $20,927 | $16,150 |
| Standard Deviation (Sample) | $16,197 | $15,009 |
| Standard Deviation (Population) | $16,074 | $14,890 |
Demographics Similar to Immigrants from Czechoslovakia and Immigrants from Malaysia by Per Capita Income
In terms of per capita income, the demographic groups most similar to Immigrants from Czechoslovakia are Cambodian ($51,731, a difference of 0.070%), Immigrants from Korea ($51,671, a difference of 0.19%), Immigrants from South Africa ($51,465, a difference of 0.59%), Immigrants from Turkey ($51,368, a difference of 0.78%), and Immigrants from Lithuania ($51,361, a difference of 0.80%). Similarly, the demographic groups most similar to Immigrants from Malaysia are South African ($50,044, a difference of 0.12%), Asian ($50,057, a difference of 0.15%), Immigrants from Western Europe ($50,065, a difference of 0.16%), Immigrants from Belarus ($50,303, a difference of 0.64%), and Paraguayan ($50,385, a difference of 0.81%).
| Demographics | Rating | Rank | Per Capita Income |
| Immigrants | Czechoslovakia | 100.0 /100 | #38 | Exceptional $51,770 |
| Cambodians | 100.0 /100 | #39 | Exceptional $51,731 |
| Immigrants | Korea | 100.0 /100 | #40 | Exceptional $51,671 |
| Immigrants | South Africa | 100.0 /100 | #41 | Exceptional $51,465 |
| Immigrants | Turkey | 100.0 /100 | #42 | Exceptional $51,368 |
| Immigrants | Lithuania | 100.0 /100 | #43 | Exceptional $51,361 |
| Immigrants | Europe | 100.0 /100 | #44 | Exceptional $50,950 |
| Immigrants | Spain | 100.0 /100 | #45 | Exceptional $50,933 |
| Immigrants | Latvia | 100.0 /100 | #46 | Exceptional $50,914 |
| Bulgarians | 100.0 /100 | #47 | Exceptional $50,906 |
| Immigrants | Serbia | 100.0 /100 | #48 | Exceptional $50,810 |
| New Zealanders | 100.0 /100 | #49 | Exceptional $50,575 |
| Immigrants | Sri Lanka | 100.0 /100 | #50 | Exceptional $50,555 |
| Immigrants | Netherlands | 100.0 /100 | #51 | Exceptional $50,458 |
| Immigrants | Croatia | 99.9 /100 | #52 | Exceptional $50,417 |
| Paraguayans | 99.9 /100 | #53 | Exceptional $50,385 |
| Immigrants | Belarus | 99.9 /100 | #54 | Exceptional $50,303 |
| Immigrants | Western Europe | 99.9 /100 | #55 | Exceptional $50,065 |
| Asians | 99.9 /100 | #56 | Exceptional $50,057 |
| South Africans | 99.9 /100 | #57 | Exceptional $50,044 |
| Immigrants | Malaysia | 99.9 /100 | #58 | Exceptional $49,983 |