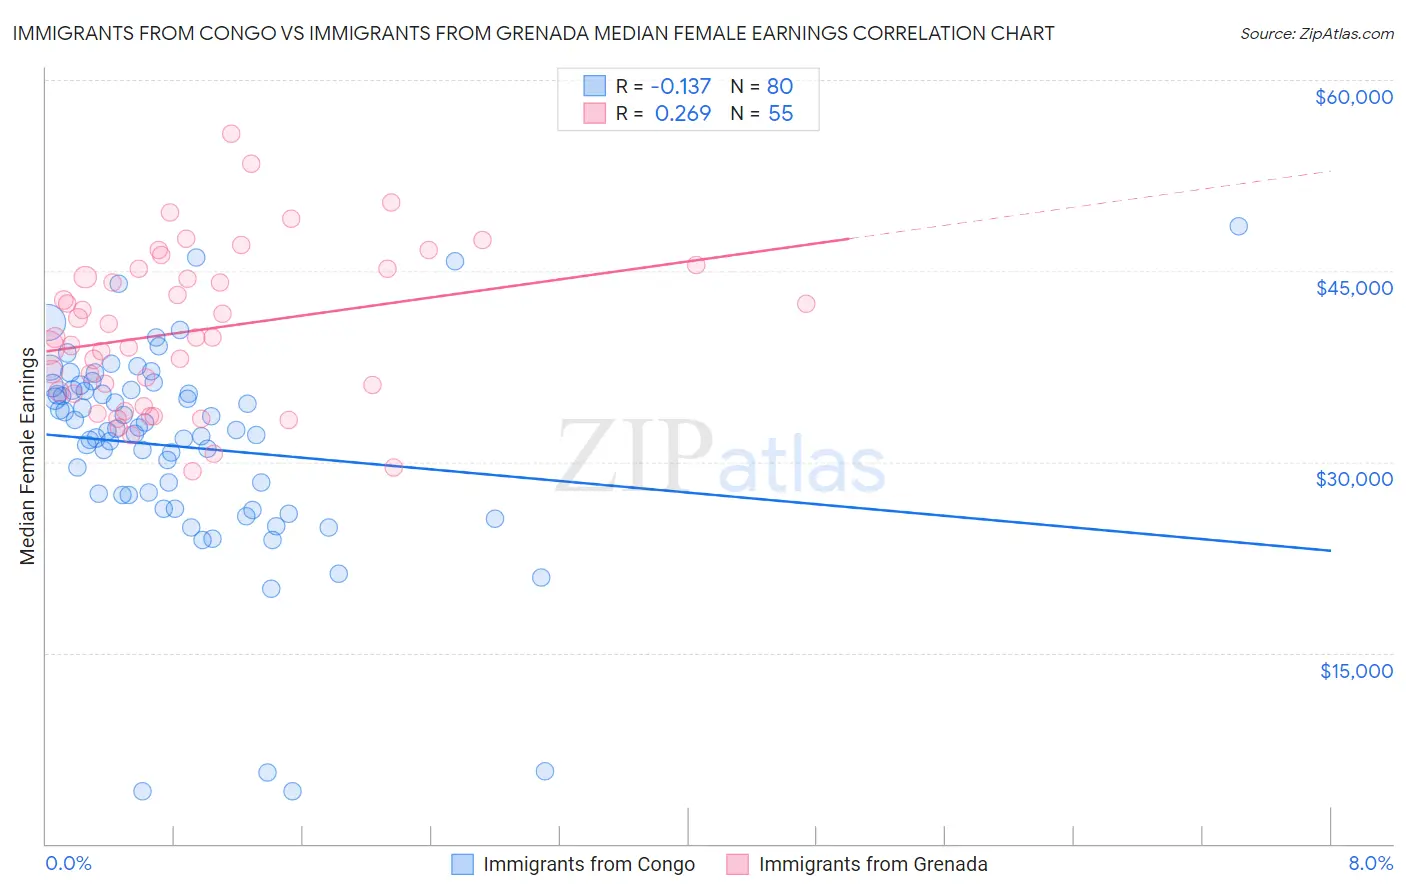
Immigrants from Congo vs Immigrants from Grenada Median Female Earnings
COMPARE
Immigrants from Congo
Immigrants from Grenada
Median Female Earnings
Median Female Earnings Comparison
Immigrants from Congo
Immigrants from Grenada
$34,317
MEDIAN FEMALE EARNINGS
0.0/ 100
METRIC RATING
324th/ 347
METRIC RANK
$41,932
MEDIAN FEMALE EARNINGS
99.0/ 100
METRIC RATING
93rd/ 347
METRIC RANK
Immigrants from Congo vs Immigrants from Grenada Median Female Earnings Correlation Chart
The statistical analysis conducted on geographies consisting of 92,121,393 people shows a poor negative correlation between the proportion of Immigrants from Congo and median female earnings in the United States with a correlation coefficient (R) of -0.137 and weighted average of $34,317. Similarly, the statistical analysis conducted on geographies consisting of 67,190,904 people shows a weak positive correlation between the proportion of Immigrants from Grenada and median female earnings in the United States with a correlation coefficient (R) of 0.269 and weighted average of $41,932, a difference of 22.2%.
Median Female Earnings Correlation Summary
| Measurement | Immigrants from Congo | Immigrants from Grenada |
| Minimum | $4,095 | $29,237 |
| Maximum | $48,487 | $55,809 |
| Range | $44,392 | $26,572 |
| Mean | $31,171 | $40,324 |
| Median | $32,459 | $39,773 |
| Interquartile 25% (IQ1) | $27,374 | $35,346 |
| Interquartile 75% (IQ3) | $35,656 | $45,180 |
| Interquartile Range (IQR) | $8,283 | $9,834 |
| Standard Deviation (Sample) | $8,300 | $6,162 |
| Standard Deviation (Population) | $8,248 | $6,105 |
Similar Demographics by Median Female Earnings
Demographics Similar to Immigrants from Congo by Median Female Earnings
In terms of median female earnings, the demographic groups most similar to Immigrants from Congo are Seminole ($34,385, a difference of 0.20%), Chickasaw ($34,414, a difference of 0.28%), Hispanic or Latino ($34,421, a difference of 0.31%), Dutch West Indian ($34,106, a difference of 0.62%), and Kiowa ($34,074, a difference of 0.71%).
| Demographics | Rating | Rank | Median Female Earnings |
| Potawatomi | 0.0 /100 | #317 | Tragic $34,739 |
| Immigrants | Yemen | 0.0 /100 | #318 | Tragic $34,693 |
| Shoshone | 0.0 /100 | #319 | Tragic $34,677 |
| Immigrants | Honduras | 0.0 /100 | #320 | Tragic $34,647 |
| Hispanics or Latinos | 0.0 /100 | #321 | Tragic $34,421 |
| Chickasaw | 0.0 /100 | #322 | Tragic $34,414 |
| Seminole | 0.0 /100 | #323 | Tragic $34,385 |
| Immigrants | Congo | 0.0 /100 | #324 | Tragic $34,317 |
| Dutch West Indians | 0.0 /100 | #325 | Tragic $34,106 |
| Kiowa | 0.0 /100 | #326 | Tragic $34,074 |
| Cajuns | 0.0 /100 | #327 | Tragic $34,034 |
| Immigrants | Central America | 0.0 /100 | #328 | Tragic $33,953 |
| Hopi | 0.0 /100 | #329 | Tragic $33,932 |
| Menominee | 0.0 /100 | #330 | Tragic $33,894 |
| Natives/Alaskans | 0.0 /100 | #331 | Tragic $33,806 |
Demographics Similar to Immigrants from Grenada by Median Female Earnings
In terms of median female earnings, the demographic groups most similar to Immigrants from Grenada are Argentinean ($41,952, a difference of 0.050%), Immigrants from Western Europe ($41,990, a difference of 0.14%), Moroccan ($41,872, a difference of 0.14%), Immigrants from Netherlands ($41,870, a difference of 0.15%), and Ukrainian ($42,015, a difference of 0.20%).
| Demographics | Rating | Rank | Median Female Earnings |
| Immigrants | St. Vincent and the Grenadines | 99.3 /100 | #86 | Exceptional $42,108 |
| Lithuanians | 99.3 /100 | #87 | Exceptional $42,108 |
| Immigrants | Northern Africa | 99.3 /100 | #88 | Exceptional $42,084 |
| Immigrants | Afghanistan | 99.3 /100 | #89 | Exceptional $42,055 |
| Ukrainians | 99.2 /100 | #90 | Exceptional $42,015 |
| Immigrants | Western Europe | 99.2 /100 | #91 | Exceptional $41,990 |
| Argentineans | 99.1 /100 | #92 | Exceptional $41,952 |
| Immigrants | Grenada | 99.0 /100 | #93 | Exceptional $41,932 |
| Moroccans | 98.9 /100 | #94 | Exceptional $41,872 |
| Immigrants | Netherlands | 98.9 /100 | #95 | Exceptional $41,870 |
| South Africans | 98.8 /100 | #96 | Exceptional $41,825 |
| Immigrants | Hungary | 98.8 /100 | #97 | Exceptional $41,820 |
| Immigrants | Scotland | 98.7 /100 | #98 | Exceptional $41,771 |
| Immigrants | Barbados | 98.4 /100 | #99 | Exceptional $41,685 |
| Romanians | 98.3 /100 | #100 | Exceptional $41,663 |