Immigrants from Colombia vs Lebanese Householder Income Ages 25 - 44 years
COMPARE
Immigrants from Colombia
Lebanese
Householder Income Ages 25 - 44 years
Householder Income Ages 25 - 44 years Comparison
Immigrants from Colombia
Lebanese
$92,204
HOUSEHOLDER INCOME AGES 25 - 44 YEARS
21.3/ 100
METRIC RATING
196th/ 347
METRIC RANK
$97,339
HOUSEHOLDER INCOME AGES 25 - 44 YEARS
82.3/ 100
METRIC RATING
137th/ 347
METRIC RANK
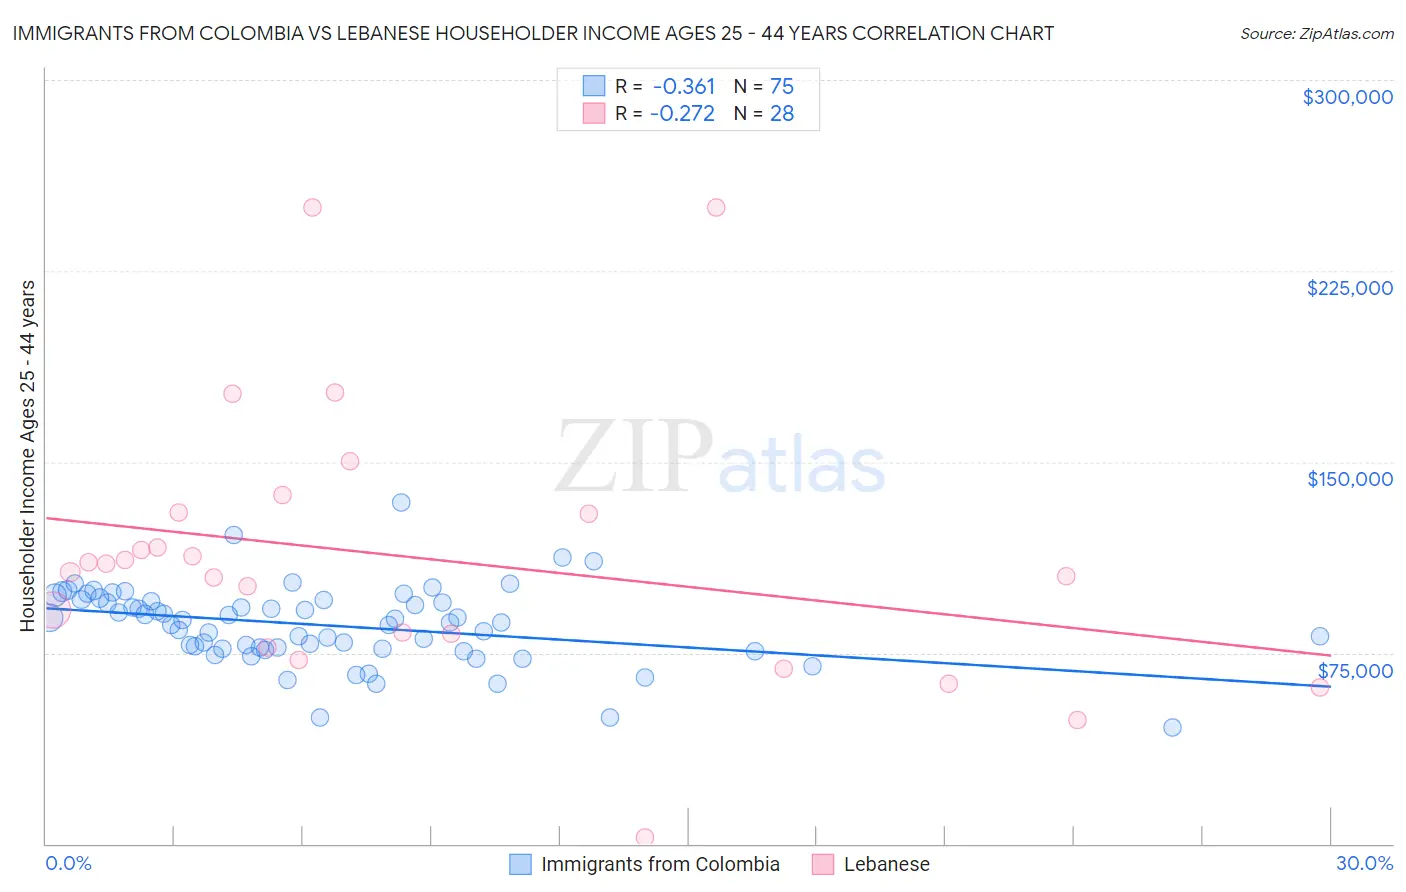
Immigrants from Colombia vs Lebanese Householder Income Ages 25 - 44 years Correlation Chart
The statistical analysis conducted on geographies consisting of 377,972,893 people shows a mild negative correlation between the proportion of Immigrants from Colombia and household income with householder between the ages 25 and 44 in the United States with a correlation coefficient (R) of -0.361 and weighted average of $92,204. Similarly, the statistical analysis conducted on geographies consisting of 400,475,460 people shows a weak negative correlation between the proportion of Lebanese and household income with householder between the ages 25 and 44 in the United States with a correlation coefficient (R) of -0.272 and weighted average of $97,339, a difference of 5.6%.
Householder Income Ages 25 - 44 years Correlation Summary
| Measurement | Immigrants from Colombia | Lebanese |
| Minimum | $45,673 | $2,499 |
| Maximum | $134,128 | $250,001 |
| Range | $88,455 | $247,502 |
| Mean | $85,778 | $112,372 |
| Median | $86,881 | $108,314 |
| Interquartile 25% (IQ1) | $76,505 | $79,902 |
| Interquartile 75% (IQ3) | $95,862 | $129,887 |
| Interquartile Range (IQR) | $19,357 | $49,985 |
| Standard Deviation (Sample) | $15,210 | $53,521 |
| Standard Deviation (Population) | $15,108 | $52,557 |
Similar Demographics by Householder Income Ages 25 - 44 years
Demographics Similar to Immigrants from Colombia by Householder Income Ages 25 - 44 years
In terms of householder income ages 25 - 44 years, the demographic groups most similar to Immigrants from Colombia are Spanish ($92,200, a difference of 0.0%), Celtic ($92,241, a difference of 0.040%), Vietnamese ($92,089, a difference of 0.12%), Immigrants from the Azores ($92,322, a difference of 0.13%), and Samoan ($92,385, a difference of 0.20%).
| Demographics | Rating | Rank | Householder Income Ages 25 - 44 years |
| Dutch | 30.5 /100 | #189 | Fair $93,081 |
| Welsh | 30.0 /100 | #190 | Fair $93,039 |
| Tlingit-Haida | 29.4 /100 | #191 | Fair $92,987 |
| Immigrants | Costa Rica | 28.2 /100 | #192 | Fair $92,876 |
| Samoans | 23.0 /100 | #193 | Fair $92,385 |
| Immigrants | Azores | 22.4 /100 | #194 | Fair $92,322 |
| Celtics | 21.6 /100 | #195 | Fair $92,241 |
| Immigrants | Colombia | 21.3 /100 | #196 | Fair $92,204 |
| Spanish | 21.2 /100 | #197 | Fair $92,200 |
| Vietnamese | 20.2 /100 | #198 | Fair $92,089 |
| Kenyans | 16.8 /100 | #199 | Poor $91,684 |
| Whites/Caucasians | 16.7 /100 | #200 | Poor $91,668 |
| Japanese | 16.4 /100 | #201 | Poor $91,624 |
| Ecuadorians | 16.0 /100 | #202 | Poor $91,574 |
| Immigrants | Cambodia | 15.7 /100 | #203 | Poor $91,533 |
Demographics Similar to Lebanese by Householder Income Ages 25 - 44 years
In terms of householder income ages 25 - 44 years, the demographic groups most similar to Lebanese are Arab ($97,336, a difference of 0.0%), Immigrants from Peru ($97,329, a difference of 0.010%), Immigrants from Morocco ($97,305, a difference of 0.030%), Luxembourger ($97,237, a difference of 0.10%), and Danish ($97,221, a difference of 0.12%).
| Demographics | Rating | Rank | Householder Income Ages 25 - 44 years |
| Immigrants | Kuwait | 87.8 /100 | #130 | Excellent $98,122 |
| Immigrants | Albania | 86.6 /100 | #131 | Excellent $97,929 |
| Immigrants | Zimbabwe | 86.3 /100 | #132 | Excellent $97,880 |
| Tsimshian | 85.8 /100 | #133 | Excellent $97,809 |
| Canadians | 84.5 /100 | #134 | Excellent $97,625 |
| Immigrants | Oceania | 84.5 /100 | #135 | Excellent $97,623 |
| Hungarians | 83.9 /100 | #136 | Excellent $97,544 |
| Lebanese | 82.3 /100 | #137 | Excellent $97,339 |
| Arabs | 82.3 /100 | #138 | Excellent $97,336 |
| Immigrants | Peru | 82.2 /100 | #139 | Excellent $97,329 |
| Immigrants | Morocco | 82.0 /100 | #140 | Excellent $97,305 |
| Luxembourgers | 81.5 /100 | #141 | Excellent $97,237 |
| Danes | 81.3 /100 | #142 | Excellent $97,221 |
| Immigrants | Jordan | 81.0 /100 | #143 | Excellent $97,185 |
| Immigrants | Chile | 80.8 /100 | #144 | Excellent $97,159 |