Immigrants from Colombia vs Assyrian/Chaldean/Syriac 4th Grade
COMPARE
Immigrants from Colombia
Assyrian/Chaldean/Syriac
4th Grade
4th Grade Comparison
Immigrants from Colombia
Assyrians/Chaldeans/Syriacs
97.0%
4TH GRADE
0.5/ 100
METRIC RATING
258th/ 347
METRIC RANK
97.2%
4TH GRADE
3.0/ 100
METRIC RATING
234th/ 347
METRIC RANK
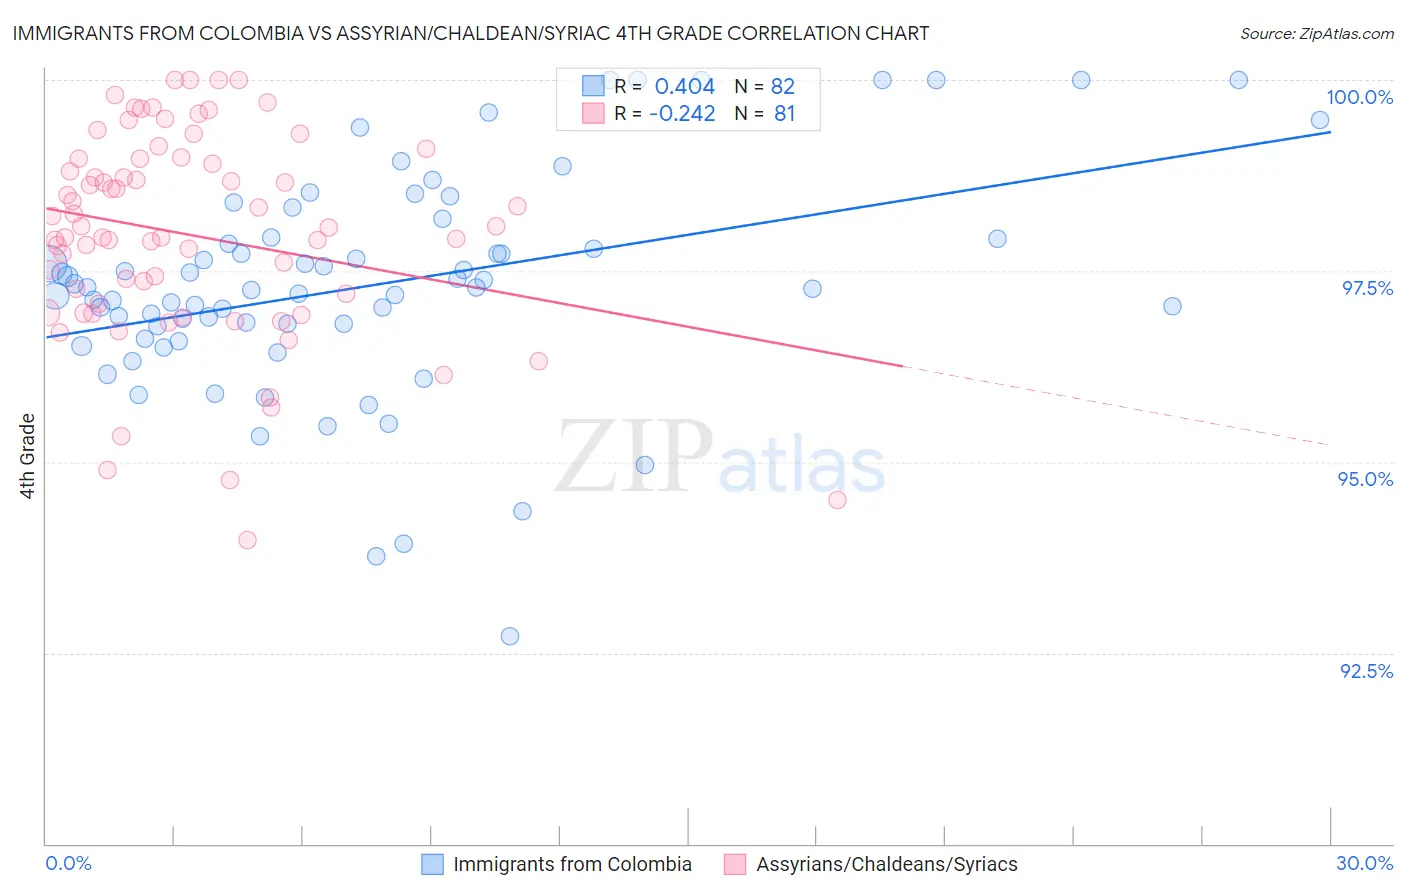
Immigrants from Colombia vs Assyrian/Chaldean/Syriac 4th Grade Correlation Chart
The statistical analysis conducted on geographies consisting of 378,643,693 people shows a moderate positive correlation between the proportion of Immigrants from Colombia and percentage of population with at least 4th grade education in the United States with a correlation coefficient (R) of 0.404 and weighted average of 97.0%. Similarly, the statistical analysis conducted on geographies consisting of 110,318,304 people shows a weak negative correlation between the proportion of Assyrians/Chaldeans/Syriacs and percentage of population with at least 4th grade education in the United States with a correlation coefficient (R) of -0.242 and weighted average of 97.2%, a difference of 0.18%.
4th Grade Correlation Summary
| Measurement | Immigrants from Colombia | Assyrian/Chaldean/Syriac |
| Minimum | 92.7% | 94.0% |
| Maximum | 100.0% | 100.0% |
| Range | 7.3% | 6.0% |
| Mean | 97.3% | 98.0% |
| Median | 97.3% | 98.1% |
| Interquartile 25% (IQ1) | 96.8% | 97.0% |
| Interquartile 75% (IQ3) | 97.9% | 99.0% |
| Interquartile Range (IQR) | 1.1% | 2.0% |
| Standard Deviation (Sample) | 1.4% | 1.4% |
| Standard Deviation (Population) | 1.4% | 1.3% |
Similar Demographics by 4th Grade
Demographics Similar to Immigrants from Colombia by 4th Grade
In terms of 4th grade, the demographic groups most similar to Immigrants from Colombia are Immigrants from Congo (97.0%, a difference of 0.0%), Immigrants from Ethiopia (97.0%, a difference of 0.010%), Immigrants from Sierra Leone (97.0%, a difference of 0.020%), Immigrants from South America (97.0%, a difference of 0.020%), and West Indian (97.0%, a difference of 0.030%).
| Demographics | Rating | Rank | 4th Grade |
| South Americans | 0.8 /100 | #251 | Tragic 97.1% |
| Jamaicans | 0.8 /100 | #252 | Tragic 97.1% |
| Immigrants | Liberia | 0.8 /100 | #253 | Tragic 97.1% |
| Immigrants | Middle Africa | 0.8 /100 | #254 | Tragic 97.1% |
| Peruvians | 0.7 /100 | #255 | Tragic 97.1% |
| Bolivians | 0.7 /100 | #256 | Tragic 97.1% |
| Immigrants | Congo | 0.5 /100 | #257 | Tragic 97.0% |
| Immigrants | Colombia | 0.5 /100 | #258 | Tragic 97.0% |
| Immigrants | Ethiopia | 0.4 /100 | #259 | Tragic 97.0% |
| Immigrants | Sierra Leone | 0.4 /100 | #260 | Tragic 97.0% |
| Immigrants | South America | 0.4 /100 | #261 | Tragic 97.0% |
| West Indians | 0.4 /100 | #262 | Tragic 97.0% |
| Immigrants | Jamaica | 0.3 /100 | #263 | Tragic 97.0% |
| Taiwanese | 0.3 /100 | #264 | Tragic 97.0% |
| Armenians | 0.3 /100 | #265 | Tragic 97.0% |
Demographics Similar to Assyrians/Chaldeans/Syriacs by 4th Grade
In terms of 4th grade, the demographic groups most similar to Assyrians/Chaldeans/Syriacs are Senegalese (97.2%, a difference of 0.0%), Yuman (97.2%, a difference of 0.0%), Immigrants from Malaysia (97.2%, a difference of 0.010%), Immigrants from Western Asia (97.2%, a difference of 0.010%), and Immigrants from Eastern Asia (97.2%, a difference of 0.010%).
| Demographics | Rating | Rank | 4th Grade |
| Immigrants | Pakistan | 3.7 /100 | #227 | Tragic 97.2% |
| Sub-Saharan Africans | 3.6 /100 | #228 | Tragic 97.2% |
| Liberians | 3.6 /100 | #229 | Tragic 97.2% |
| Uruguayans | 3.5 /100 | #230 | Tragic 97.2% |
| Immigrants | Malaysia | 3.4 /100 | #231 | Tragic 97.2% |
| Immigrants | Western Asia | 3.4 /100 | #232 | Tragic 97.2% |
| Senegalese | 3.1 /100 | #233 | Tragic 97.2% |
| Assyrians/Chaldeans/Syriacs | 3.0 /100 | #234 | Tragic 97.2% |
| Yuman | 2.9 /100 | #235 | Tragic 97.2% |
| Immigrants | Eastern Asia | 2.7 /100 | #236 | Tragic 97.2% |
| Immigrants | Costa Rica | 2.0 /100 | #237 | Tragic 97.2% |
| Indians (Asian) | 1.9 /100 | #238 | Tragic 97.2% |
| Nigerians | 1.8 /100 | #239 | Tragic 97.1% |
| Colombians | 1.6 /100 | #240 | Tragic 97.1% |
| Immigrants | Indonesia | 1.5 /100 | #241 | Tragic 97.1% |