Immigrants from Central America vs Indian (Asian) Householder Income Ages 25 - 44 years
COMPARE
Immigrants from Central America
Indian (Asian)
Householder Income Ages 25 - 44 years
Householder Income Ages 25 - 44 years Comparison
Immigrants from Central America
Indians (Asian)
$80,012
HOUSEHOLDER INCOME AGES 25 - 44 YEARS
0.0/ 100
METRIC RATING
308th/ 347
METRIC RANK
$119,496
HOUSEHOLDER INCOME AGES 25 - 44 YEARS
100.0/ 100
METRIC RATING
10th/ 347
METRIC RANK
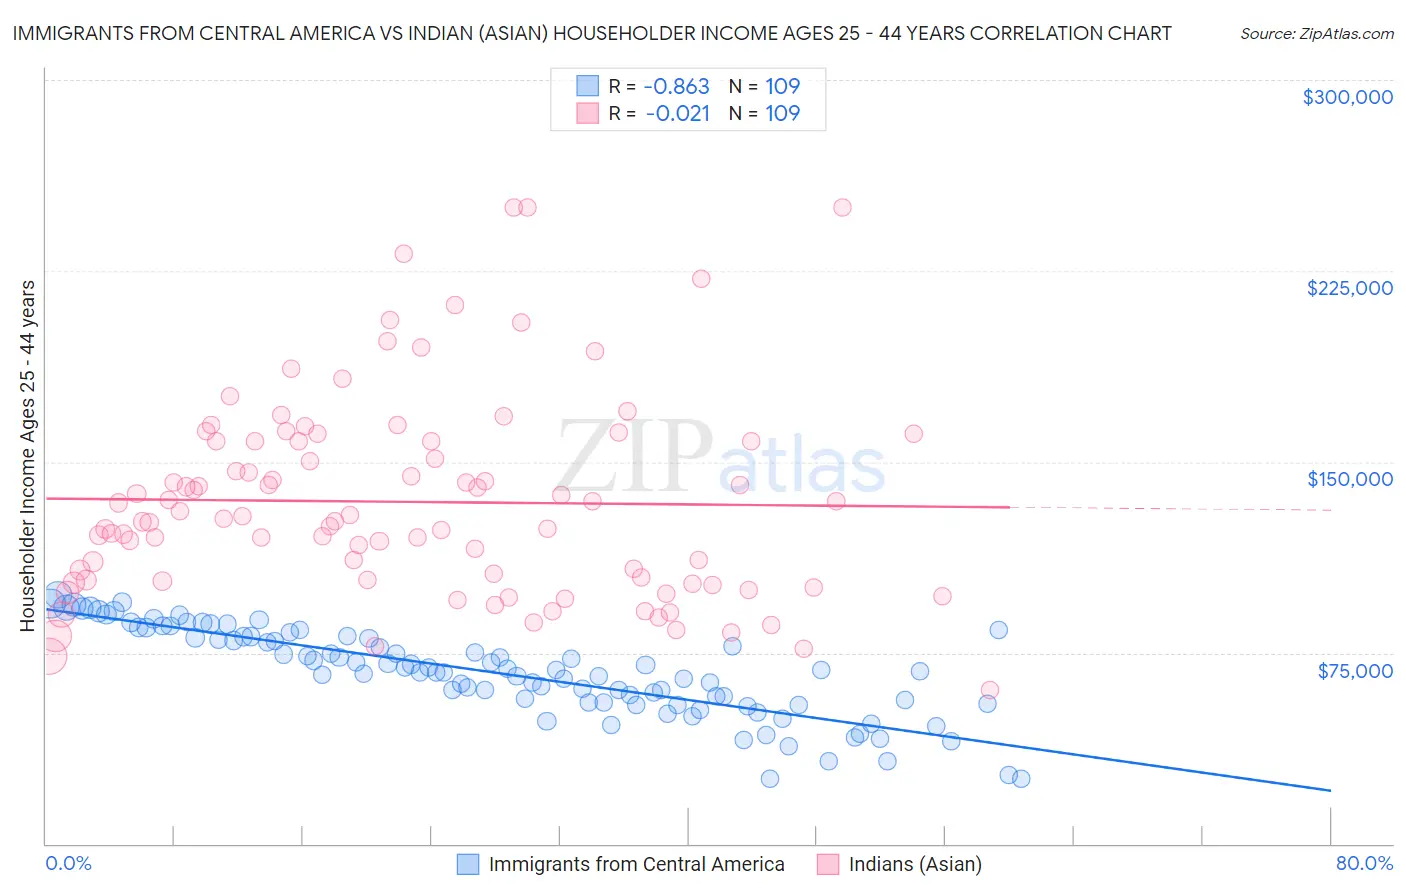
Immigrants from Central America vs Indian (Asian) Householder Income Ages 25 - 44 years Correlation Chart
The statistical analysis conducted on geographies consisting of 532,829,838 people shows a very strong negative correlation between the proportion of Immigrants from Central America and household income with householder between the ages 25 and 44 in the United States with a correlation coefficient (R) of -0.863 and weighted average of $80,012. Similarly, the statistical analysis conducted on geographies consisting of 493,231,420 people shows no correlation between the proportion of Indians (Asian) and household income with householder between the ages 25 and 44 in the United States with a correlation coefficient (R) of -0.021 and weighted average of $119,496, a difference of 49.3%.
Householder Income Ages 25 - 44 years Correlation Summary
| Measurement | Immigrants from Central America | Indian (Asian) |
| Minimum | $25,500 | $60,448 |
| Maximum | $97,900 | $250,001 |
| Range | $72,400 | $189,553 |
| Mean | $67,406 | $134,282 |
| Median | $68,457 | $127,538 |
| Interquartile 25% (IQ1) | $55,448 | $103,285 |
| Interquartile 75% (IQ3) | $81,287 | $158,064 |
| Interquartile Range (IQR) | $25,840 | $54,779 |
| Standard Deviation (Sample) | $17,129 | $39,616 |
| Standard Deviation (Population) | $17,050 | $39,434 |
Similar Demographics by Householder Income Ages 25 - 44 years
Demographics Similar to Immigrants from Central America by Householder Income Ages 25 - 44 years
In terms of householder income ages 25 - 44 years, the demographic groups most similar to Immigrants from Central America are Chippewa ($80,005, a difference of 0.010%), Haitian ($80,055, a difference of 0.050%), Fijian ($79,956, a difference of 0.070%), Apache ($80,260, a difference of 0.31%), and Immigrants from Dominican Republic ($80,319, a difference of 0.38%).
| Demographics | Rating | Rank | Householder Income Ages 25 - 44 years |
| Immigrants | Micronesia | 0.0 /100 | #301 | Tragic $80,544 |
| Hispanics or Latinos | 0.0 /100 | #302 | Tragic $80,515 |
| Mexicans | 0.0 /100 | #303 | Tragic $80,427 |
| Immigrants | Caribbean | 0.0 /100 | #304 | Tragic $80,326 |
| Immigrants | Dominican Republic | 0.0 /100 | #305 | Tragic $80,319 |
| Apache | 0.0 /100 | #306 | Tragic $80,260 |
| Haitians | 0.0 /100 | #307 | Tragic $80,055 |
| Immigrants | Central America | 0.0 /100 | #308 | Tragic $80,012 |
| Chippewa | 0.0 /100 | #309 | Tragic $80,005 |
| Fijians | 0.0 /100 | #310 | Tragic $79,956 |
| Indonesians | 0.0 /100 | #311 | Tragic $79,543 |
| Immigrants | Haiti | 0.0 /100 | #312 | Tragic $79,391 |
| Menominee | 0.0 /100 | #313 | Tragic $79,358 |
| Cheyenne | 0.0 /100 | #314 | Tragic $79,152 |
| Ottawa | 0.0 /100 | #315 | Tragic $79,012 |
Demographics Similar to Indians (Asian) by Householder Income Ages 25 - 44 years
In terms of householder income ages 25 - 44 years, the demographic groups most similar to Indians (Asian) are Okinawan ($119,349, a difference of 0.12%), Immigrants from China ($119,756, a difference of 0.22%), Immigrants from Iran ($119,204, a difference of 0.25%), Iranian ($120,292, a difference of 0.67%), and Immigrants from Ireland ($120,333, a difference of 0.70%).
| Demographics | Rating | Rank | Householder Income Ages 25 - 44 years |
| Immigrants | Hong Kong | 100.0 /100 | #3 | Exceptional $128,140 |
| Immigrants | Singapore | 100.0 /100 | #4 | Exceptional $124,429 |
| Immigrants | India | 100.0 /100 | #5 | Exceptional $124,238 |
| Thais | 100.0 /100 | #6 | Exceptional $121,778 |
| Immigrants | Ireland | 100.0 /100 | #7 | Exceptional $120,333 |
| Iranians | 100.0 /100 | #8 | Exceptional $120,292 |
| Immigrants | China | 100.0 /100 | #9 | Exceptional $119,756 |
| Indians (Asian) | 100.0 /100 | #10 | Exceptional $119,496 |
| Okinawans | 100.0 /100 | #11 | Exceptional $119,349 |
| Immigrants | Iran | 100.0 /100 | #12 | Exceptional $119,204 |
| Immigrants | Eastern Asia | 100.0 /100 | #13 | Exceptional $118,056 |
| Immigrants | Israel | 100.0 /100 | #14 | Exceptional $117,219 |
| Immigrants | South Central Asia | 100.0 /100 | #15 | Exceptional $116,626 |
| Cypriots | 100.0 /100 | #16 | Exceptional $116,364 |
| Immigrants | Australia | 100.0 /100 | #17 | Exceptional $115,947 |