Immigrants from Central America vs Navajo Householder Income Ages 25 - 44 years
COMPARE
Immigrants from Central America
Navajo
Householder Income Ages 25 - 44 years
Householder Income Ages 25 - 44 years Comparison
Immigrants from Central America
Navajo
$80,012
HOUSEHOLDER INCOME AGES 25 - 44 YEARS
0.0/ 100
METRIC RATING
308th/ 347
METRIC RANK
$66,529
HOUSEHOLDER INCOME AGES 25 - 44 YEARS
0.0/ 100
METRIC RATING
345th/ 347
METRIC RANK
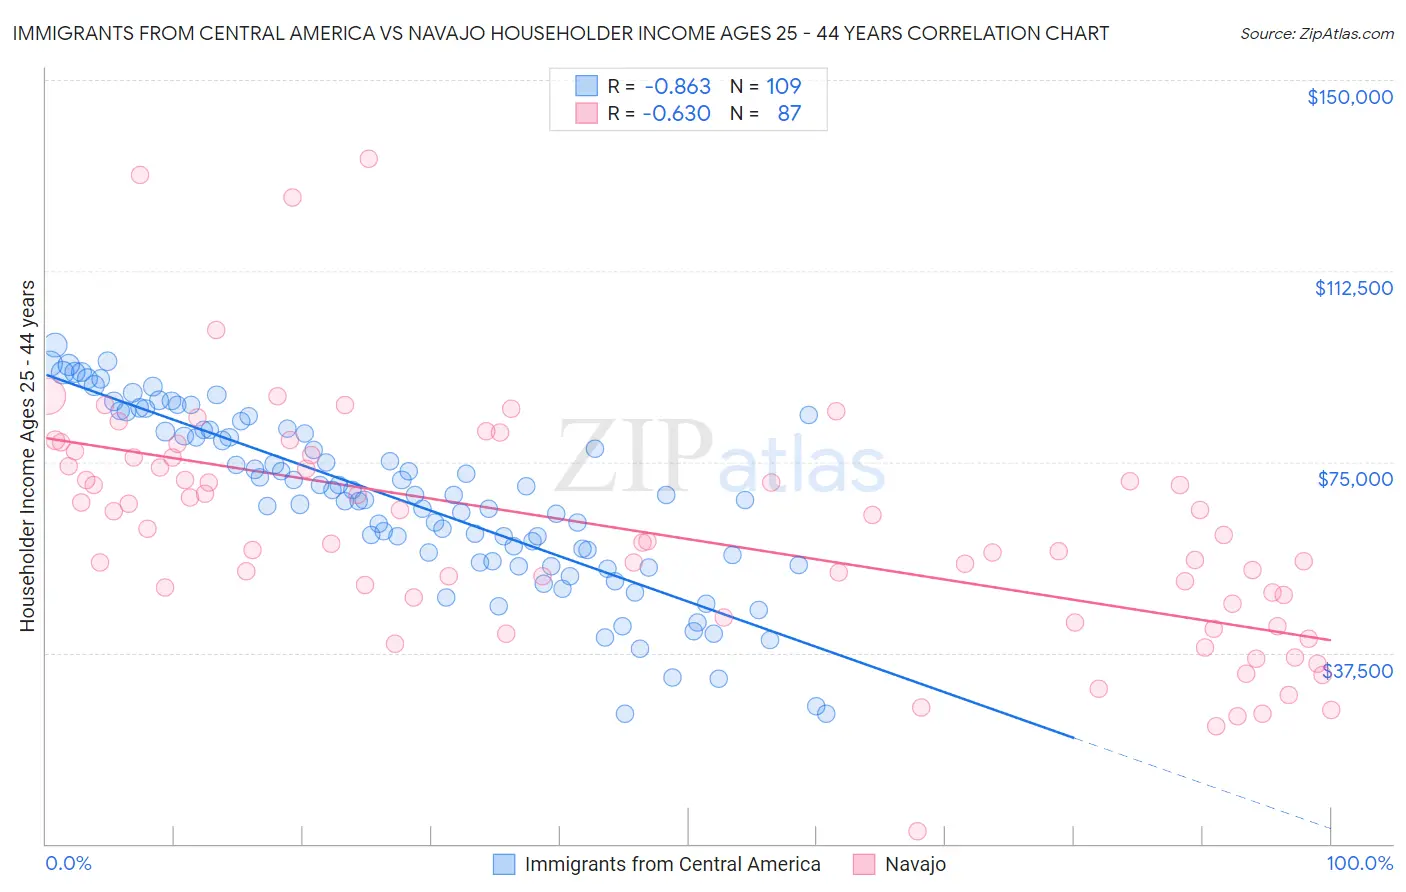
Immigrants from Central America vs Navajo Householder Income Ages 25 - 44 years Correlation Chart
The statistical analysis conducted on geographies consisting of 532,829,838 people shows a very strong negative correlation between the proportion of Immigrants from Central America and household income with householder between the ages 25 and 44 in the United States with a correlation coefficient (R) of -0.863 and weighted average of $80,012. Similarly, the statistical analysis conducted on geographies consisting of 224,307,883 people shows a significant negative correlation between the proportion of Navajo and household income with householder between the ages 25 and 44 in the United States with a correlation coefficient (R) of -0.630 and weighted average of $66,529, a difference of 20.3%.
Householder Income Ages 25 - 44 years Correlation Summary
| Measurement | Immigrants from Central America | Navajo |
| Minimum | $25,500 | $2,499 |
| Maximum | $97,900 | $134,464 |
| Range | $72,400 | $131,965 |
| Mean | $67,406 | $61,342 |
| Median | $68,457 | $59,389 |
| Interquartile 25% (IQ1) | $55,448 | $47,194 |
| Interquartile 75% (IQ3) | $81,287 | $75,867 |
| Interquartile Range (IQR) | $25,840 | $28,673 |
| Standard Deviation (Sample) | $17,129 | $22,974 |
| Standard Deviation (Population) | $17,050 | $22,841 |
Similar Demographics by Householder Income Ages 25 - 44 years
Demographics Similar to Immigrants from Central America by Householder Income Ages 25 - 44 years
In terms of householder income ages 25 - 44 years, the demographic groups most similar to Immigrants from Central America are Chippewa ($80,005, a difference of 0.010%), Haitian ($80,055, a difference of 0.050%), Fijian ($79,956, a difference of 0.070%), Apache ($80,260, a difference of 0.31%), and Immigrants from Dominican Republic ($80,319, a difference of 0.38%).
| Demographics | Rating | Rank | Householder Income Ages 25 - 44 years |
| Immigrants | Micronesia | 0.0 /100 | #301 | Tragic $80,544 |
| Hispanics or Latinos | 0.0 /100 | #302 | Tragic $80,515 |
| Mexicans | 0.0 /100 | #303 | Tragic $80,427 |
| Immigrants | Caribbean | 0.0 /100 | #304 | Tragic $80,326 |
| Immigrants | Dominican Republic | 0.0 /100 | #305 | Tragic $80,319 |
| Apache | 0.0 /100 | #306 | Tragic $80,260 |
| Haitians | 0.0 /100 | #307 | Tragic $80,055 |
| Immigrants | Central America | 0.0 /100 | #308 | Tragic $80,012 |
| Chippewa | 0.0 /100 | #309 | Tragic $80,005 |
| Fijians | 0.0 /100 | #310 | Tragic $79,956 |
| Indonesians | 0.0 /100 | #311 | Tragic $79,543 |
| Immigrants | Haiti | 0.0 /100 | #312 | Tragic $79,391 |
| Menominee | 0.0 /100 | #313 | Tragic $79,358 |
| Cheyenne | 0.0 /100 | #314 | Tragic $79,152 |
| Ottawa | 0.0 /100 | #315 | Tragic $79,012 |
Demographics Similar to Navajo by Householder Income Ages 25 - 44 years
In terms of householder income ages 25 - 44 years, the demographic groups most similar to Navajo are Puerto Rican ($65,996, a difference of 0.81%), Pueblo ($68,910, a difference of 3.6%), Tohono O'odham ($69,068, a difference of 3.8%), Crow ($71,337, a difference of 7.2%), and Arapaho ($71,697, a difference of 7.8%).
| Demographics | Rating | Rank | Householder Income Ages 25 - 44 years |
| Hopi | 0.0 /100 | #333 | Tragic $75,002 |
| Creek | 0.0 /100 | #334 | Tragic $74,847 |
| Kiowa | 0.0 /100 | #335 | Tragic $74,776 |
| Yup'ik | 0.0 /100 | #336 | Tragic $73,688 |
| Blacks/African Americans | 0.0 /100 | #337 | Tragic $73,370 |
| Immigrants | Yemen | 0.0 /100 | #338 | Tragic $73,043 |
| Yuman | 0.0 /100 | #339 | Tragic $72,956 |
| Immigrants | Congo | 0.0 /100 | #340 | Tragic $72,178 |
| Arapaho | 0.0 /100 | #341 | Tragic $71,697 |
| Crow | 0.0 /100 | #342 | Tragic $71,337 |
| Tohono O'odham | 0.0 /100 | #343 | Tragic $69,068 |
| Pueblo | 0.0 /100 | #344 | Tragic $68,910 |
| Navajo | 0.0 /100 | #345 | Tragic $66,529 |
| Puerto Ricans | 0.0 /100 | #346 | Tragic $65,996 |
| Lumbee | 0.0 /100 | #347 | Tragic $60,305 |