Immigrants from Argentina vs Immigrants from Kuwait Householder Income Ages 45 - 64 years
COMPARE
Immigrants from Argentina
Immigrants from Kuwait
Householder Income Ages 45 - 64 years
Householder Income Ages 45 - 64 years Comparison
Immigrants from Argentina
Immigrants from Kuwait
$108,264
HOUSEHOLDER INCOME AGES 45 - 64 YEARS
98.2/ 100
METRIC RATING
96th/ 347
METRIC RANK
$106,285
HOUSEHOLDER INCOME AGES 45 - 64 YEARS
95.2/ 100
METRIC RATING
115th/ 347
METRIC RANK
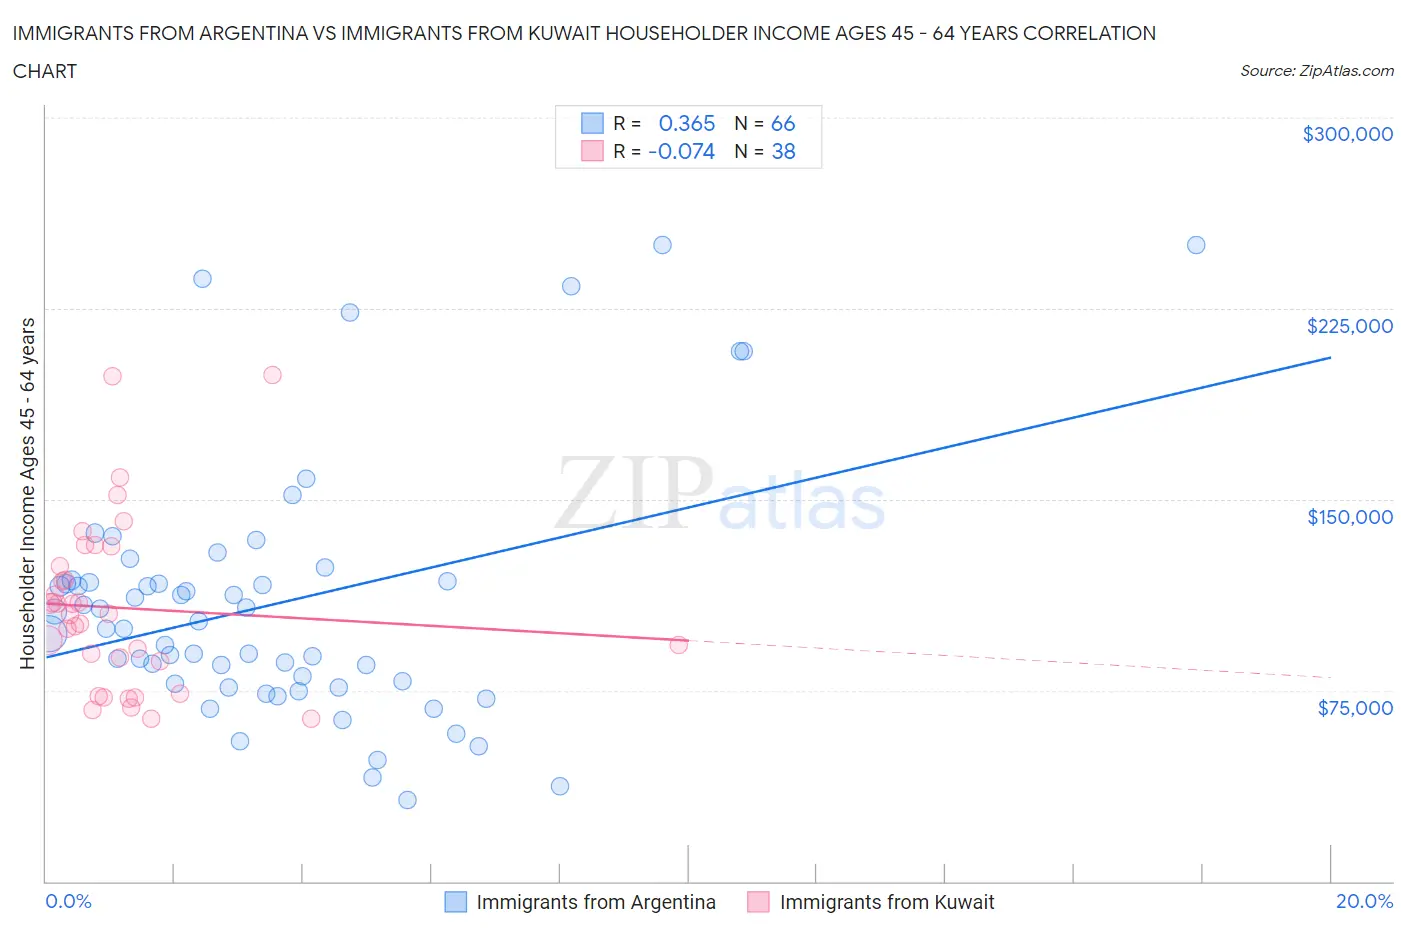
Immigrants from Argentina vs Immigrants from Kuwait Householder Income Ages 45 - 64 years Correlation Chart
The statistical analysis conducted on geographies consisting of 264,240,865 people shows a mild positive correlation between the proportion of Immigrants from Argentina and household income with householder between the ages 45 and 64 in the United States with a correlation coefficient (R) of 0.365 and weighted average of $108,264. Similarly, the statistical analysis conducted on geographies consisting of 136,856,886 people shows a slight negative correlation between the proportion of Immigrants from Kuwait and household income with householder between the ages 45 and 64 in the United States with a correlation coefficient (R) of -0.074 and weighted average of $106,285, a difference of 1.9%.
Householder Income Ages 45 - 64 years Correlation Summary
| Measurement | Immigrants from Argentina | Immigrants from Kuwait |
| Minimum | $31,738 | $63,767 |
| Maximum | $250,001 | $198,648 |
| Range | $218,263 | $134,881 |
| Mean | $109,127 | $107,348 |
| Median | $100,704 | $104,899 |
| Interquartile 25% (IQ1) | $77,665 | $86,528 |
| Interquartile 75% (IQ3) | $117,604 | $123,748 |
| Interquartile Range (IQR) | $39,939 | $37,220 |
| Standard Deviation (Sample) | $49,794 | $33,135 |
| Standard Deviation (Population) | $49,415 | $32,696 |
Demographics Similar to Immigrants from Argentina and Immigrants from Kuwait by Householder Income Ages 45 - 64 years
In terms of householder income ages 45 - 64 years, the demographic groups most similar to Immigrants from Argentina are Immigrants from Hungary ($108,267, a difference of 0.0%), Northern European ($107,870, a difference of 0.37%), Immigrants from Southern Europe ($107,775, a difference of 0.45%), Palestinian ($107,721, a difference of 0.50%), and Immigrants from Serbia ($107,569, a difference of 0.65%). Similarly, the demographic groups most similar to Immigrants from Kuwait are Immigrants from Poland ($106,319, a difference of 0.030%), European ($106,367, a difference of 0.080%), Swedish ($106,377, a difference of 0.090%), Immigrants from Vietnam ($106,417, a difference of 0.13%), and Immigrants from Brazil ($106,470, a difference of 0.17%).
| Demographics | Rating | Rank | Householder Income Ages 45 - 64 years |
| Immigrants | Hungary | 98.2 /100 | #95 | Exceptional $108,267 |
| Immigrants | Argentina | 98.2 /100 | #96 | Exceptional $108,264 |
| Northern Europeans | 97.8 /100 | #97 | Exceptional $107,870 |
| Immigrants | Southern Europe | 97.7 /100 | #98 | Exceptional $107,775 |
| Palestinians | 97.6 /100 | #99 | Exceptional $107,721 |
| Immigrants | Serbia | 97.4 /100 | #100 | Exceptional $107,569 |
| Immigrants | Kazakhstan | 97.2 /100 | #101 | Exceptional $107,378 |
| Immigrants | Moldova | 97.1 /100 | #102 | Exceptional $107,357 |
| Syrians | 96.9 /100 | #103 | Exceptional $107,207 |
| Immigrants | Ukraine | 96.7 /100 | #104 | Exceptional $107,079 |
| Macedonians | 96.7 /100 | #105 | Exceptional $107,074 |
| Armenians | 96.6 /100 | #106 | Exceptional $107,002 |
| Immigrants | Fiji | 96.5 /100 | #107 | Exceptional $106,952 |
| Zimbabweans | 96.3 /100 | #108 | Exceptional $106,849 |
| Chileans | 95.9 /100 | #109 | Exceptional $106,611 |
| Immigrants | Brazil | 95.6 /100 | #110 | Exceptional $106,470 |
| Immigrants | Vietnam | 95.5 /100 | #111 | Exceptional $106,417 |
| Swedes | 95.4 /100 | #112 | Exceptional $106,377 |
| Europeans | 95.4 /100 | #113 | Exceptional $106,367 |
| Immigrants | Poland | 95.3 /100 | #114 | Exceptional $106,319 |
| Immigrants | Kuwait | 95.2 /100 | #115 | Exceptional $106,285 |