Immigrants from Germany vs Immigrants from Kuwait Householder Income Ages 45 - 64 years
COMPARE
Immigrants from Germany
Immigrants from Kuwait
Householder Income Ages 45 - 64 years
Householder Income Ages 45 - 64 years Comparison
Immigrants from Germany
Immigrants from Kuwait
$103,282
HOUSEHOLDER INCOME AGES 45 - 64 YEARS
81.5/ 100
METRIC RATING
148th/ 347
METRIC RANK
$106,285
HOUSEHOLDER INCOME AGES 45 - 64 YEARS
95.2/ 100
METRIC RATING
115th/ 347
METRIC RANK
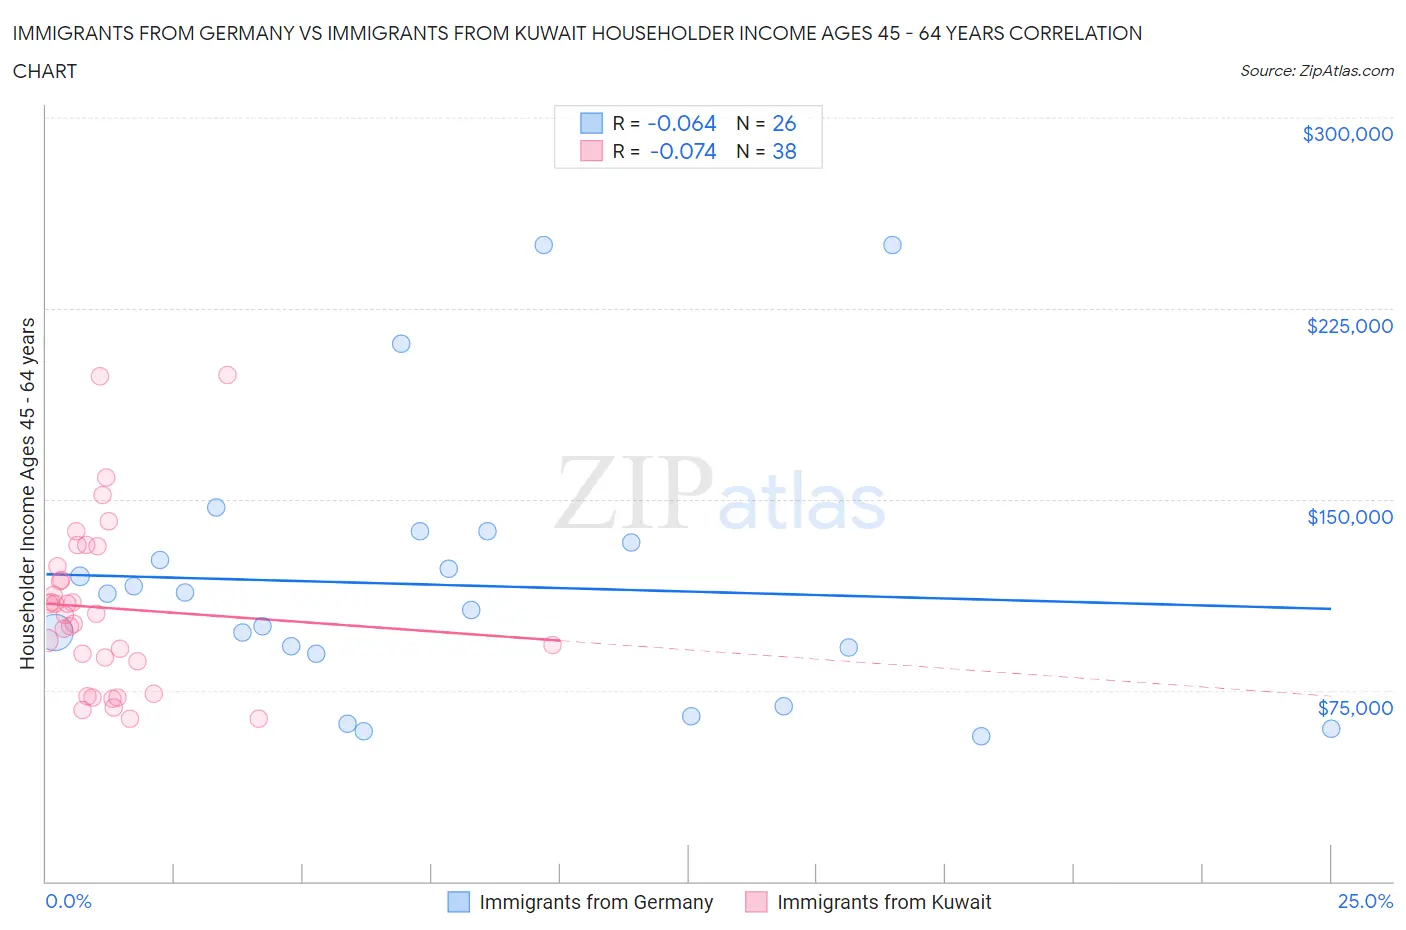
Immigrants from Germany vs Immigrants from Kuwait Householder Income Ages 45 - 64 years Correlation Chart
The statistical analysis conducted on geographies consisting of 463,046,856 people shows a slight negative correlation between the proportion of Immigrants from Germany and household income with householder between the ages 45 and 64 in the United States with a correlation coefficient (R) of -0.064 and weighted average of $103,282. Similarly, the statistical analysis conducted on geographies consisting of 136,856,886 people shows a slight negative correlation between the proportion of Immigrants from Kuwait and household income with householder between the ages 45 and 64 in the United States with a correlation coefficient (R) of -0.074 and weighted average of $106,285, a difference of 2.9%.
Householder Income Ages 45 - 64 years Correlation Summary
| Measurement | Immigrants from Germany | Immigrants from Kuwait |
| Minimum | $56,731 | $63,767 |
| Maximum | $250,001 | $198,648 |
| Range | $193,270 | $134,881 |
| Mean | $116,317 | $107,348 |
| Median | $109,777 | $104,899 |
| Interquartile 25% (IQ1) | $89,417 | $86,528 |
| Interquartile 75% (IQ3) | $133,088 | $123,748 |
| Interquartile Range (IQR) | $43,671 | $37,220 |
| Standard Deviation (Sample) | $52,104 | $33,135 |
| Standard Deviation (Population) | $51,092 | $32,696 |
Similar Demographics by Householder Income Ages 45 - 64 years
Demographics Similar to Immigrants from Germany by Householder Income Ages 45 - 64 years
In terms of householder income ages 45 - 64 years, the demographic groups most similar to Immigrants from Germany are Immigrants from Sierra Leone ($103,227, a difference of 0.050%), Basque ($103,387, a difference of 0.10%), Immigrants from Peru ($103,173, a difference of 0.11%), Immigrants from Chile ($103,412, a difference of 0.13%), and Ugandan ($103,472, a difference of 0.18%).
| Demographics | Rating | Rank | Householder Income Ages 45 - 64 years |
| Immigrants | Uganda | 83.7 /100 | #141 | Excellent $103,584 |
| Luxembourgers | 83.3 /100 | #142 | Excellent $103,536 |
| Serbians | 83.2 /100 | #143 | Excellent $103,522 |
| Czechs | 83.1 /100 | #144 | Excellent $103,507 |
| Ugandans | 82.9 /100 | #145 | Excellent $103,472 |
| Immigrants | Chile | 82.5 /100 | #146 | Excellent $103,412 |
| Basques | 82.3 /100 | #147 | Excellent $103,387 |
| Immigrants | Germany | 81.5 /100 | #148 | Excellent $103,282 |
| Immigrants | Sierra Leone | 81.1 /100 | #149 | Excellent $103,227 |
| Immigrants | Peru | 80.7 /100 | #150 | Excellent $103,173 |
| Swiss | 79.9 /100 | #151 | Good $103,071 |
| Irish | 79.8 /100 | #152 | Good $103,067 |
| Scandinavians | 79.0 /100 | #153 | Good $102,969 |
| Slovenes | 78.3 /100 | #154 | Good $102,885 |
| Costa Ricans | 77.4 /100 | #155 | Good $102,779 |
Demographics Similar to Immigrants from Kuwait by Householder Income Ages 45 - 64 years
In terms of householder income ages 45 - 64 years, the demographic groups most similar to Immigrants from Kuwait are British ($106,264, a difference of 0.020%), Immigrants from Poland ($106,319, a difference of 0.030%), Albanian ($106,243, a difference of 0.040%), Immigrants from Western Asia ($106,217, a difference of 0.060%), and European ($106,367, a difference of 0.080%).
| Demographics | Rating | Rank | Householder Income Ages 45 - 64 years |
| Zimbabweans | 96.3 /100 | #108 | Exceptional $106,849 |
| Chileans | 95.9 /100 | #109 | Exceptional $106,611 |
| Immigrants | Brazil | 95.6 /100 | #110 | Exceptional $106,470 |
| Immigrants | Vietnam | 95.5 /100 | #111 | Exceptional $106,417 |
| Swedes | 95.4 /100 | #112 | Exceptional $106,377 |
| Europeans | 95.4 /100 | #113 | Exceptional $106,367 |
| Immigrants | Poland | 95.3 /100 | #114 | Exceptional $106,319 |
| Immigrants | Kuwait | 95.2 /100 | #115 | Exceptional $106,285 |
| British | 95.2 /100 | #116 | Exceptional $106,264 |
| Albanians | 95.1 /100 | #117 | Exceptional $106,243 |
| Immigrants | Western Asia | 95.0 /100 | #118 | Exceptional $106,217 |
| Immigrants | Jordan | 94.9 /100 | #119 | Exceptional $106,164 |
| Immigrants | South Eastern Asia | 94.8 /100 | #120 | Exceptional $106,109 |
| Poles | 94.4 /100 | #121 | Exceptional $105,952 |
| Immigrants | North Macedonia | 94.2 /100 | #122 | Exceptional $105,892 |