Immigrants from Cameroon vs Czechoslovakian Householder Income Ages 25 - 44 years
COMPARE
Immigrants from Cameroon
Czechoslovakian
Householder Income Ages 25 - 44 years
Householder Income Ages 25 - 44 years Comparison
Immigrants from Cameroon
Czechoslovakians
$88,214
HOUSEHOLDER INCOME AGES 25 - 44 YEARS
2.9/ 100
METRIC RATING
236th/ 347
METRIC RANK
$95,070
HOUSEHOLDER INCOME AGES 25 - 44 YEARS
57.0/ 100
METRIC RATING
167th/ 347
METRIC RANK
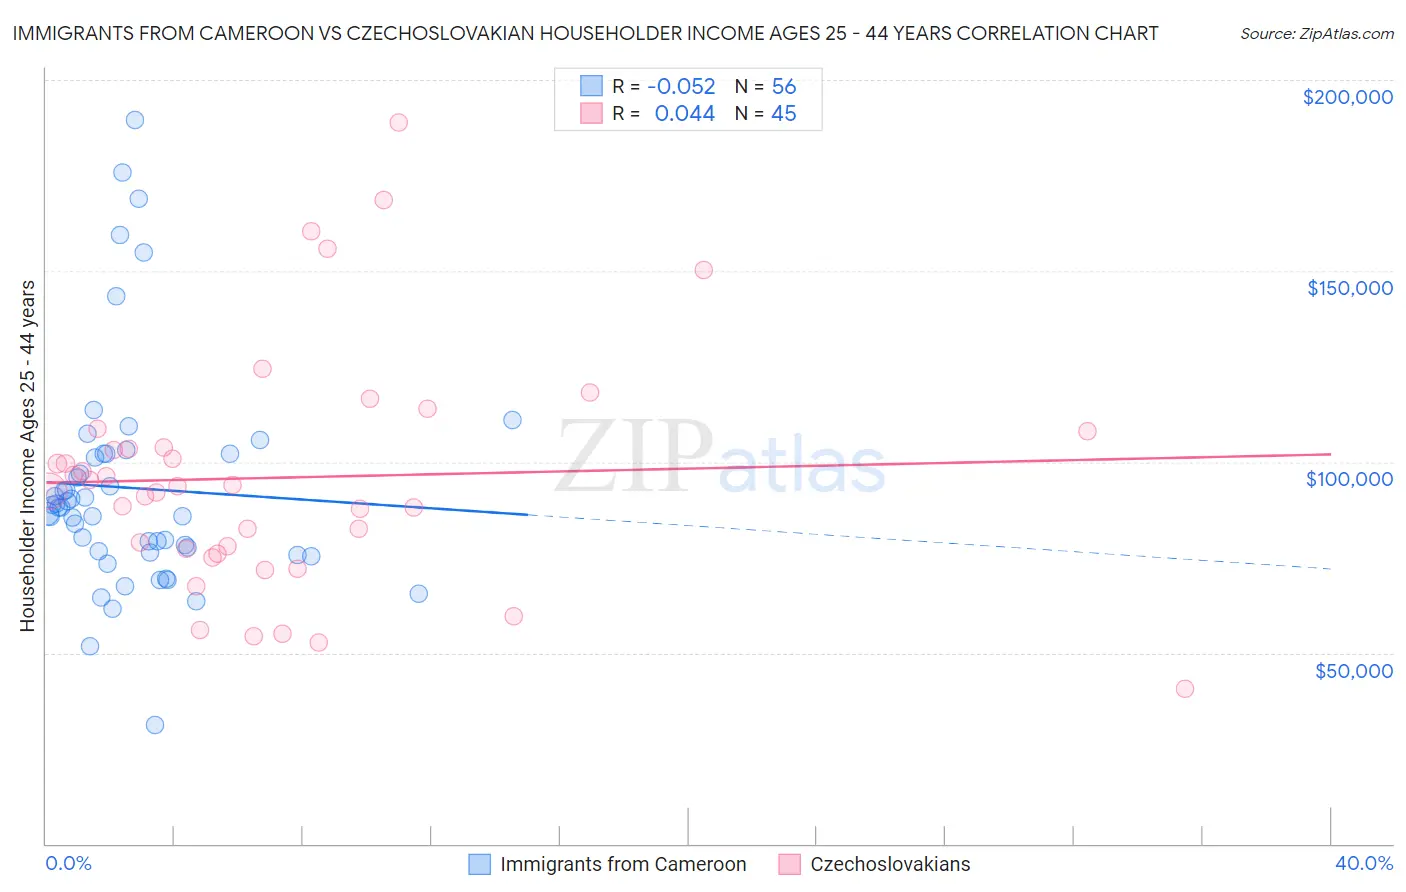
Immigrants from Cameroon vs Czechoslovakian Householder Income Ages 25 - 44 years Correlation Chart
The statistical analysis conducted on geographies consisting of 130,701,481 people shows a slight negative correlation between the proportion of Immigrants from Cameroon and household income with householder between the ages 25 and 44 in the United States with a correlation coefficient (R) of -0.052 and weighted average of $88,214. Similarly, the statistical analysis conducted on geographies consisting of 367,645,828 people shows no correlation between the proportion of Czechoslovakians and household income with householder between the ages 25 and 44 in the United States with a correlation coefficient (R) of 0.044 and weighted average of $95,070, a difference of 7.8%.
Householder Income Ages 25 - 44 years Correlation Summary
| Measurement | Immigrants from Cameroon | Czechoslovakian |
| Minimum | $31,250 | $40,625 |
| Maximum | $189,447 | $188,750 |
| Range | $158,197 | $148,125 |
| Mean | $93,103 | $95,911 |
| Median | $88,029 | $93,719 |
| Interquartile 25% (IQ1) | $76,496 | $76,645 |
| Interquartile 75% (IQ3) | $102,206 | $105,829 |
| Interquartile Range (IQR) | $25,711 | $29,184 |
| Standard Deviation (Sample) | $29,847 | $31,170 |
| Standard Deviation (Population) | $29,580 | $30,822 |
Similar Demographics by Householder Income Ages 25 - 44 years
Demographics Similar to Immigrants from Cameroon by Householder Income Ages 25 - 44 years
In terms of householder income ages 25 - 44 years, the demographic groups most similar to Immigrants from Cameroon are Venezuelan ($88,232, a difference of 0.020%), Bermudan ($88,231, a difference of 0.020%), Salvadoran ($88,198, a difference of 0.020%), Malaysian ($88,291, a difference of 0.090%), and Nonimmigrants ($88,301, a difference of 0.10%).
| Demographics | Rating | Rank | Householder Income Ages 25 - 44 years |
| Immigrants | Barbados | 3.7 /100 | #229 | Tragic $88,687 |
| Alaskan Athabascans | 3.3 /100 | #230 | Tragic $88,446 |
| Immigrants | Grenada | 3.0 /100 | #231 | Tragic $88,311 |
| Immigrants | Nonimmigrants | 3.0 /100 | #232 | Tragic $88,301 |
| Malaysians | 3.0 /100 | #233 | Tragic $88,291 |
| Venezuelans | 2.9 /100 | #234 | Tragic $88,232 |
| Bermudans | 2.9 /100 | #235 | Tragic $88,231 |
| Immigrants | Cameroon | 2.9 /100 | #236 | Tragic $88,214 |
| Salvadorans | 2.8 /100 | #237 | Tragic $88,198 |
| Alaska Natives | 2.6 /100 | #238 | Tragic $88,018 |
| Immigrants | Ghana | 2.2 /100 | #239 | Tragic $87,760 |
| Nicaraguans | 2.2 /100 | #240 | Tragic $87,751 |
| Nigerians | 2.2 /100 | #241 | Tragic $87,730 |
| West Indians | 1.7 /100 | #242 | Tragic $87,205 |
| Immigrants | West Indies | 1.5 /100 | #243 | Tragic $87,063 |
Demographics Similar to Czechoslovakians by Householder Income Ages 25 - 44 years
In terms of householder income ages 25 - 44 years, the demographic groups most similar to Czechoslovakians are Alsatian ($95,059, a difference of 0.010%), Native Hawaiian ($95,058, a difference of 0.010%), Slovak ($95,032, a difference of 0.040%), Immigrants from Ethiopia ($95,256, a difference of 0.20%), and Immigrants from Armenia ($94,867, a difference of 0.21%).
| Demographics | Rating | Rank | Householder Income Ages 25 - 44 years |
| Icelanders | 63.4 /100 | #160 | Good $95,560 |
| Immigrants | Portugal | 62.8 /100 | #161 | Good $95,512 |
| Swiss | 62.8 /100 | #162 | Good $95,511 |
| Immigrants | Saudi Arabia | 62.0 /100 | #163 | Good $95,450 |
| South Americans | 60.9 /100 | #164 | Good $95,362 |
| Immigrants | Nepal | 60.3 /100 | #165 | Good $95,322 |
| Immigrants | Ethiopia | 59.5 /100 | #166 | Average $95,256 |
| Czechoslovakians | 57.0 /100 | #167 | Average $95,070 |
| Alsatians | 56.8 /100 | #168 | Average $95,059 |
| Native Hawaiians | 56.8 /100 | #169 | Average $95,058 |
| Slovaks | 56.4 /100 | #170 | Average $95,032 |
| Immigrants | Armenia | 54.2 /100 | #171 | Average $94,867 |
| Scottish | 50.8 /100 | #172 | Average $94,622 |
| Finns | 50.6 /100 | #173 | Average $94,610 |
| Colombians | 50.0 /100 | #174 | Average $94,565 |