Immigrants from Cameroon vs Immigrants from Australia Householder Income Ages 25 - 44 years
COMPARE
Immigrants from Cameroon
Immigrants from Australia
Householder Income Ages 25 - 44 years
Householder Income Ages 25 - 44 years Comparison
Immigrants from Cameroon
Immigrants from Australia
$88,214
HOUSEHOLDER INCOME AGES 25 - 44 YEARS
2.9/ 100
METRIC RATING
236th/ 347
METRIC RANK
$115,947
HOUSEHOLDER INCOME AGES 25 - 44 YEARS
100.0/ 100
METRIC RATING
17th/ 347
METRIC RANK
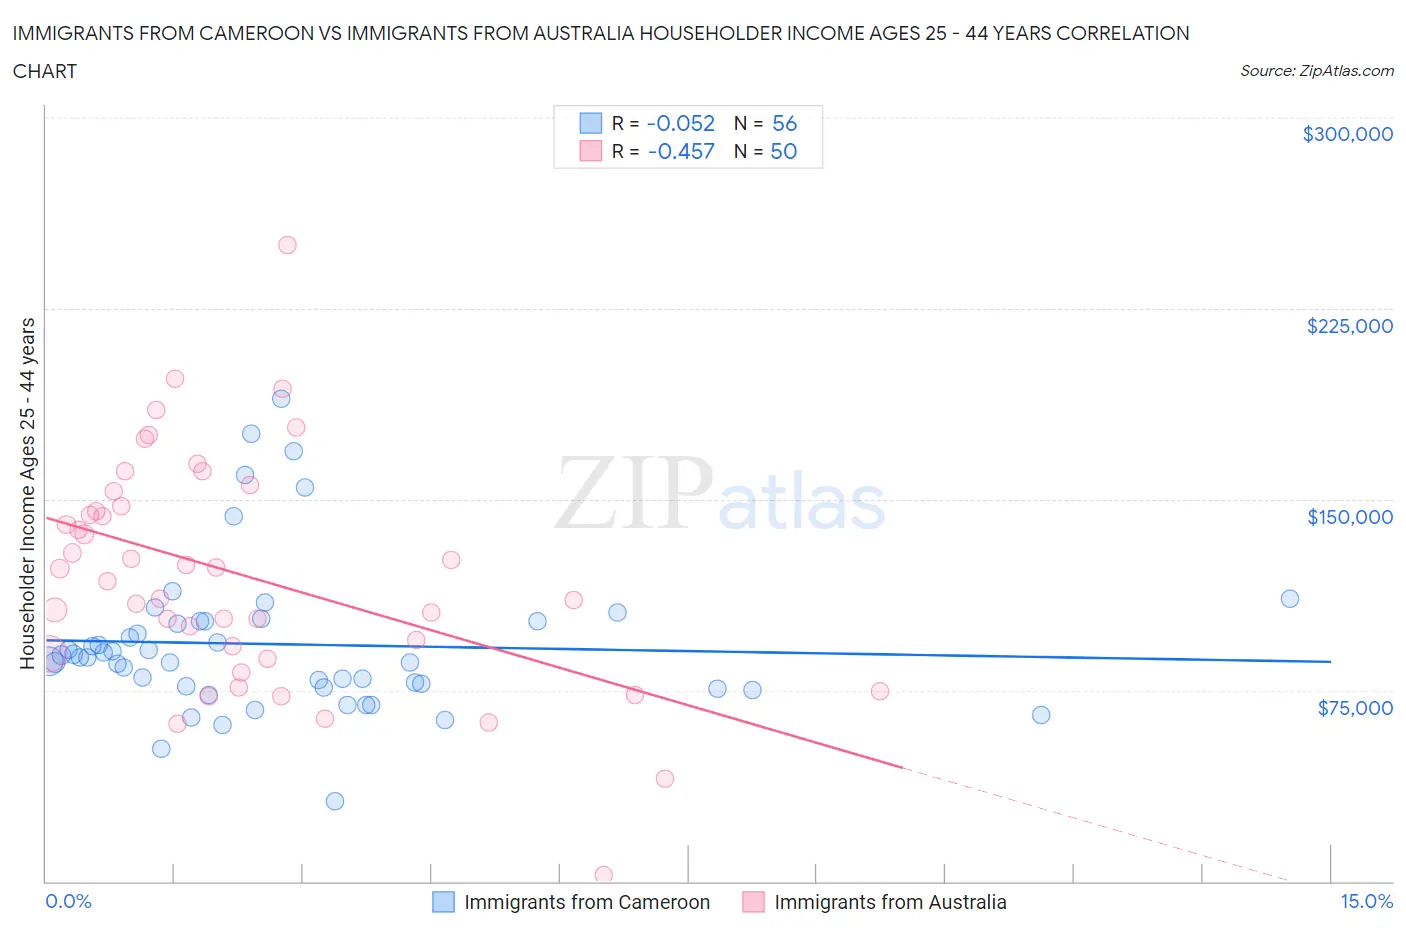
Immigrants from Cameroon vs Immigrants from Australia Householder Income Ages 25 - 44 years Correlation Chart
The statistical analysis conducted on geographies consisting of 130,701,481 people shows a slight negative correlation between the proportion of Immigrants from Cameroon and household income with householder between the ages 25 and 44 in the United States with a correlation coefficient (R) of -0.052 and weighted average of $88,214. Similarly, the statistical analysis conducted on geographies consisting of 226,902,734 people shows a moderate negative correlation between the proportion of Immigrants from Australia and household income with householder between the ages 25 and 44 in the United States with a correlation coefficient (R) of -0.457 and weighted average of $115,947, a difference of 31.4%.
Householder Income Ages 25 - 44 years Correlation Summary
| Measurement | Immigrants from Cameroon | Immigrants from Australia |
| Minimum | $31,250 | $2,499 |
| Maximum | $189,447 | $250,001 |
| Range | $158,197 | $247,502 |
| Mean | $93,103 | $120,207 |
| Median | $88,029 | $120,330 |
| Interquartile 25% (IQ1) | $76,496 | $89,211 |
| Interquartile 75% (IQ3) | $102,206 | $147,110 |
| Interquartile Range (IQR) | $25,711 | $57,899 |
| Standard Deviation (Sample) | $29,847 | $45,319 |
| Standard Deviation (Population) | $29,580 | $44,864 |
Similar Demographics by Householder Income Ages 25 - 44 years
Demographics Similar to Immigrants from Cameroon by Householder Income Ages 25 - 44 years
In terms of householder income ages 25 - 44 years, the demographic groups most similar to Immigrants from Cameroon are Venezuelan ($88,232, a difference of 0.020%), Bermudan ($88,231, a difference of 0.020%), Salvadoran ($88,198, a difference of 0.020%), Malaysian ($88,291, a difference of 0.090%), and Nonimmigrants ($88,301, a difference of 0.10%).
| Demographics | Rating | Rank | Householder Income Ages 25 - 44 years |
| Immigrants | Barbados | 3.7 /100 | #229 | Tragic $88,687 |
| Alaskan Athabascans | 3.3 /100 | #230 | Tragic $88,446 |
| Immigrants | Grenada | 3.0 /100 | #231 | Tragic $88,311 |
| Immigrants | Nonimmigrants | 3.0 /100 | #232 | Tragic $88,301 |
| Malaysians | 3.0 /100 | #233 | Tragic $88,291 |
| Venezuelans | 2.9 /100 | #234 | Tragic $88,232 |
| Bermudans | 2.9 /100 | #235 | Tragic $88,231 |
| Immigrants | Cameroon | 2.9 /100 | #236 | Tragic $88,214 |
| Salvadorans | 2.8 /100 | #237 | Tragic $88,198 |
| Alaska Natives | 2.6 /100 | #238 | Tragic $88,018 |
| Immigrants | Ghana | 2.2 /100 | #239 | Tragic $87,760 |
| Nicaraguans | 2.2 /100 | #240 | Tragic $87,751 |
| Nigerians | 2.2 /100 | #241 | Tragic $87,730 |
| West Indians | 1.7 /100 | #242 | Tragic $87,205 |
| Immigrants | West Indies | 1.5 /100 | #243 | Tragic $87,063 |
Demographics Similar to Immigrants from Australia by Householder Income Ages 25 - 44 years
In terms of householder income ages 25 - 44 years, the demographic groups most similar to Immigrants from Australia are Cypriot ($116,364, a difference of 0.36%), Immigrants from South Central Asia ($116,626, a difference of 0.59%), Immigrants from Israel ($117,219, a difference of 1.1%), Eastern European ($114,523, a difference of 1.2%), and Immigrants from Eastern Asia ($118,056, a difference of 1.8%).
| Demographics | Rating | Rank | Householder Income Ages 25 - 44 years |
| Indians (Asian) | 100.0 /100 | #10 | Exceptional $119,496 |
| Okinawans | 100.0 /100 | #11 | Exceptional $119,349 |
| Immigrants | Iran | 100.0 /100 | #12 | Exceptional $119,204 |
| Immigrants | Eastern Asia | 100.0 /100 | #13 | Exceptional $118,056 |
| Immigrants | Israel | 100.0 /100 | #14 | Exceptional $117,219 |
| Immigrants | South Central Asia | 100.0 /100 | #15 | Exceptional $116,626 |
| Cypriots | 100.0 /100 | #16 | Exceptional $116,364 |
| Immigrants | Australia | 100.0 /100 | #17 | Exceptional $115,947 |
| Eastern Europeans | 100.0 /100 | #18 | Exceptional $114,523 |
| Burmese | 100.0 /100 | #19 | Exceptional $113,701 |
| Immigrants | Korea | 100.0 /100 | #20 | Exceptional $113,401 |
| Asians | 100.0 /100 | #21 | Exceptional $112,666 |
| Immigrants | Belgium | 100.0 /100 | #22 | Exceptional $112,575 |
| Immigrants | Japan | 100.0 /100 | #23 | Exceptional $112,228 |
| Immigrants | Sweden | 100.0 /100 | #24 | Exceptional $112,010 |