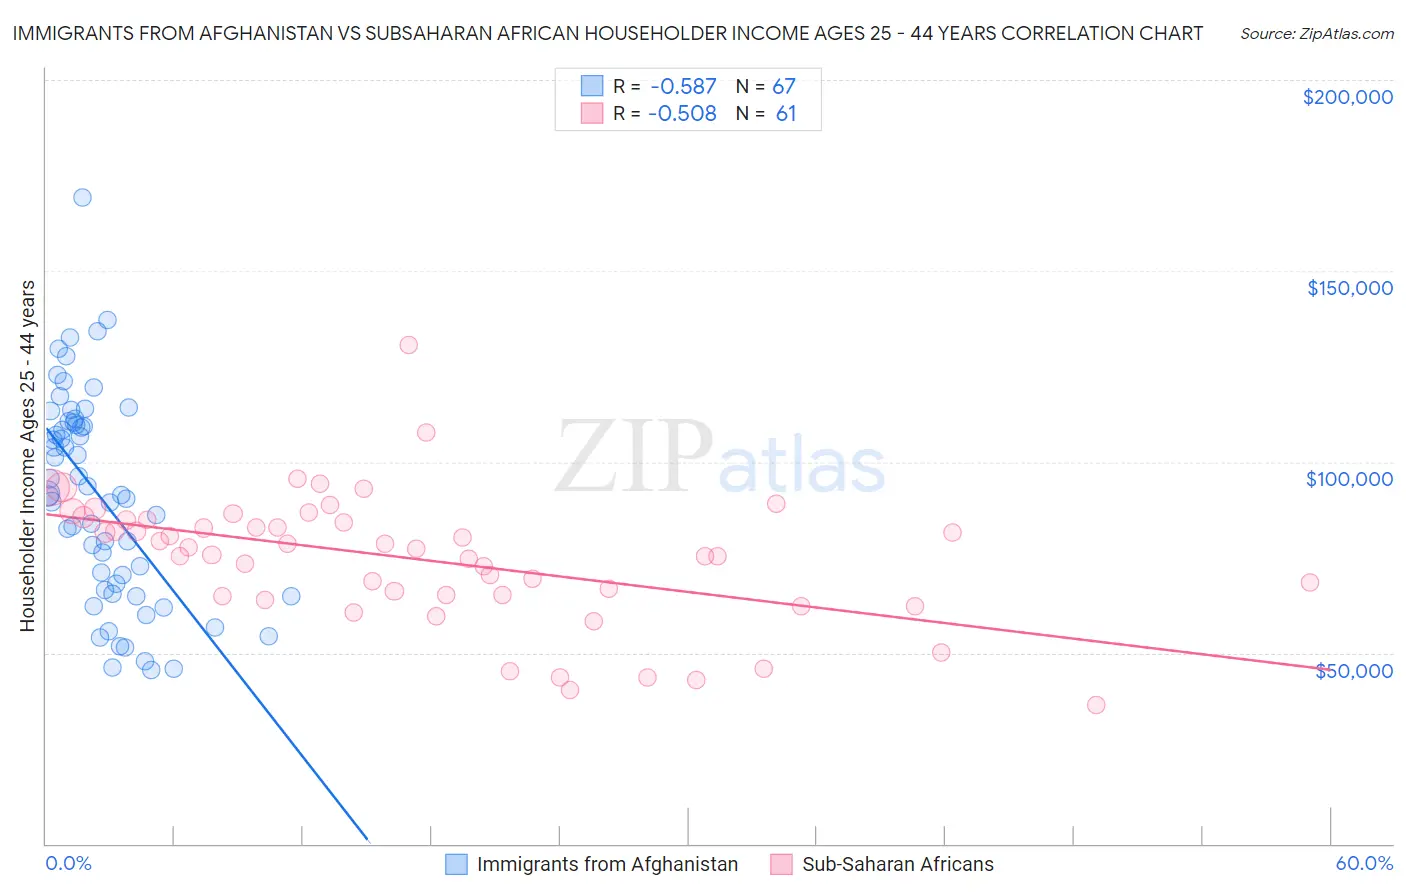
Immigrants from Afghanistan vs Subsaharan African Householder Income Ages 25 - 44 years
COMPARE
Immigrants from Afghanistan
Subsaharan African
Householder Income Ages 25 - 44 years
Householder Income Ages 25 - 44 years Comparison
Immigrants from Afghanistan
Sub-Saharan Africans
$99,977
HOUSEHOLDER INCOME AGES 25 - 44 YEARS
95.3/ 100
METRIC RATING
110th/ 347
METRIC RANK
$84,235
HOUSEHOLDER INCOME AGES 25 - 44 YEARS
0.3/ 100
METRIC RATING
268th/ 347
METRIC RANK
Immigrants from Afghanistan vs Subsaharan African Householder Income Ages 25 - 44 years Correlation Chart
The statistical analysis conducted on geographies consisting of 147,550,415 people shows a substantial negative correlation between the proportion of Immigrants from Afghanistan and household income with householder between the ages 25 and 44 in the United States with a correlation coefficient (R) of -0.587 and weighted average of $99,977. Similarly, the statistical analysis conducted on geographies consisting of 505,523,200 people shows a substantial negative correlation between the proportion of Sub-Saharan Africans and household income with householder between the ages 25 and 44 in the United States with a correlation coefficient (R) of -0.508 and weighted average of $84,235, a difference of 18.7%.
Householder Income Ages 25 - 44 years Correlation Summary
| Measurement | Immigrants from Afghanistan | Subsaharan African |
| Minimum | $45,625 | $36,409 |
| Maximum | $169,252 | $130,453 |
| Range | $123,627 | $94,044 |
| Mean | $90,836 | $74,443 |
| Median | $91,322 | $77,380 |
| Interquartile 25% (IQ1) | $66,441 | $65,093 |
| Interquartile 75% (IQ3) | $110,235 | $84,848 |
| Interquartile Range (IQR) | $43,794 | $19,755 |
| Standard Deviation (Sample) | $27,071 | $17,109 |
| Standard Deviation (Population) | $26,868 | $16,968 |
Similar Demographics by Householder Income Ages 25 - 44 years
Demographics Similar to Immigrants from Afghanistan by Householder Income Ages 25 - 44 years
In terms of householder income ages 25 - 44 years, the demographic groups most similar to Immigrants from Afghanistan are Chilean ($99,900, a difference of 0.080%), Immigrants from North Macedonia ($100,101, a difference of 0.12%), Polish ($99,685, a difference of 0.29%), Immigrants from South Eastern Asia ($100,283, a difference of 0.31%), and Tongan ($99,604, a difference of 0.37%).
| Demographics | Rating | Rank | Householder Income Ages 25 - 44 years |
| Immigrants | Moldova | 97.4 /100 | #103 | Exceptional $101,091 |
| Immigrants | Poland | 97.4 /100 | #104 | Exceptional $101,065 |
| Immigrants | Vietnam | 96.5 /100 | #105 | Exceptional $100,535 |
| Immigrants | Brazil | 96.5 /100 | #106 | Exceptional $100,534 |
| Northern Europeans | 96.3 /100 | #107 | Exceptional $100,457 |
| Immigrants | South Eastern Asia | 96.0 /100 | #108 | Exceptional $100,283 |
| Immigrants | North Macedonia | 95.6 /100 | #109 | Exceptional $100,101 |
| Immigrants | Afghanistan | 95.3 /100 | #110 | Exceptional $99,977 |
| Chileans | 95.1 /100 | #111 | Exceptional $99,900 |
| Poles | 94.5 /100 | #112 | Exceptional $99,685 |
| Tongans | 94.2 /100 | #113 | Exceptional $99,604 |
| Immigrants | Western Asia | 94.0 /100 | #114 | Exceptional $99,516 |
| Carpatho Rusyns | 93.7 /100 | #115 | Exceptional $99,449 |
| Portuguese | 93.7 /100 | #116 | Exceptional $99,429 |
| Immigrants | Northern Africa | 93.0 /100 | #117 | Exceptional $99,232 |
Demographics Similar to Sub-Saharan Africans by Householder Income Ages 25 - 44 years
In terms of householder income ages 25 - 44 years, the demographic groups most similar to Sub-Saharan Africans are Hmong ($84,258, a difference of 0.030%), Immigrants from Cabo Verde ($84,304, a difference of 0.080%), Spanish American Indian ($84,085, a difference of 0.18%), Sudanese ($84,401, a difference of 0.20%), and Osage ($84,461, a difference of 0.27%).
| Demographics | Rating | Rank | Householder Income Ages 25 - 44 years |
| Inupiat | 0.4 /100 | #261 | Tragic $84,619 |
| Cree | 0.4 /100 | #262 | Tragic $84,574 |
| Belizeans | 0.4 /100 | #263 | Tragic $84,534 |
| Osage | 0.4 /100 | #264 | Tragic $84,461 |
| Sudanese | 0.4 /100 | #265 | Tragic $84,401 |
| Immigrants | Cabo Verde | 0.3 /100 | #266 | Tragic $84,304 |
| Hmong | 0.3 /100 | #267 | Tragic $84,258 |
| Sub-Saharan Africans | 0.3 /100 | #268 | Tragic $84,235 |
| Spanish American Indians | 0.3 /100 | #269 | Tragic $84,085 |
| Jamaicans | 0.3 /100 | #270 | Tragic $83,933 |
| Somalis | 0.2 /100 | #271 | Tragic $83,752 |
| Spanish Americans | 0.2 /100 | #272 | Tragic $83,722 |
| Iroquois | 0.2 /100 | #273 | Tragic $83,682 |
| Marshallese | 0.2 /100 | #274 | Tragic $83,575 |
| Immigrants | Jamaica | 0.2 /100 | #275 | Tragic $83,298 |