Samoan vs Scottish Householder Income Ages 25 - 44 years
COMPARE
Samoan
Scottish
Householder Income Ages 25 - 44 years
Householder Income Ages 25 - 44 years Comparison
Samoans
Scottish
$92,385
HOUSEHOLDER INCOME AGES 25 - 44 YEARS
23.0/ 100
METRIC RATING
193rd/ 347
METRIC RANK
$94,622
HOUSEHOLDER INCOME AGES 25 - 44 YEARS
50.8/ 100
METRIC RATING
172nd/ 347
METRIC RANK
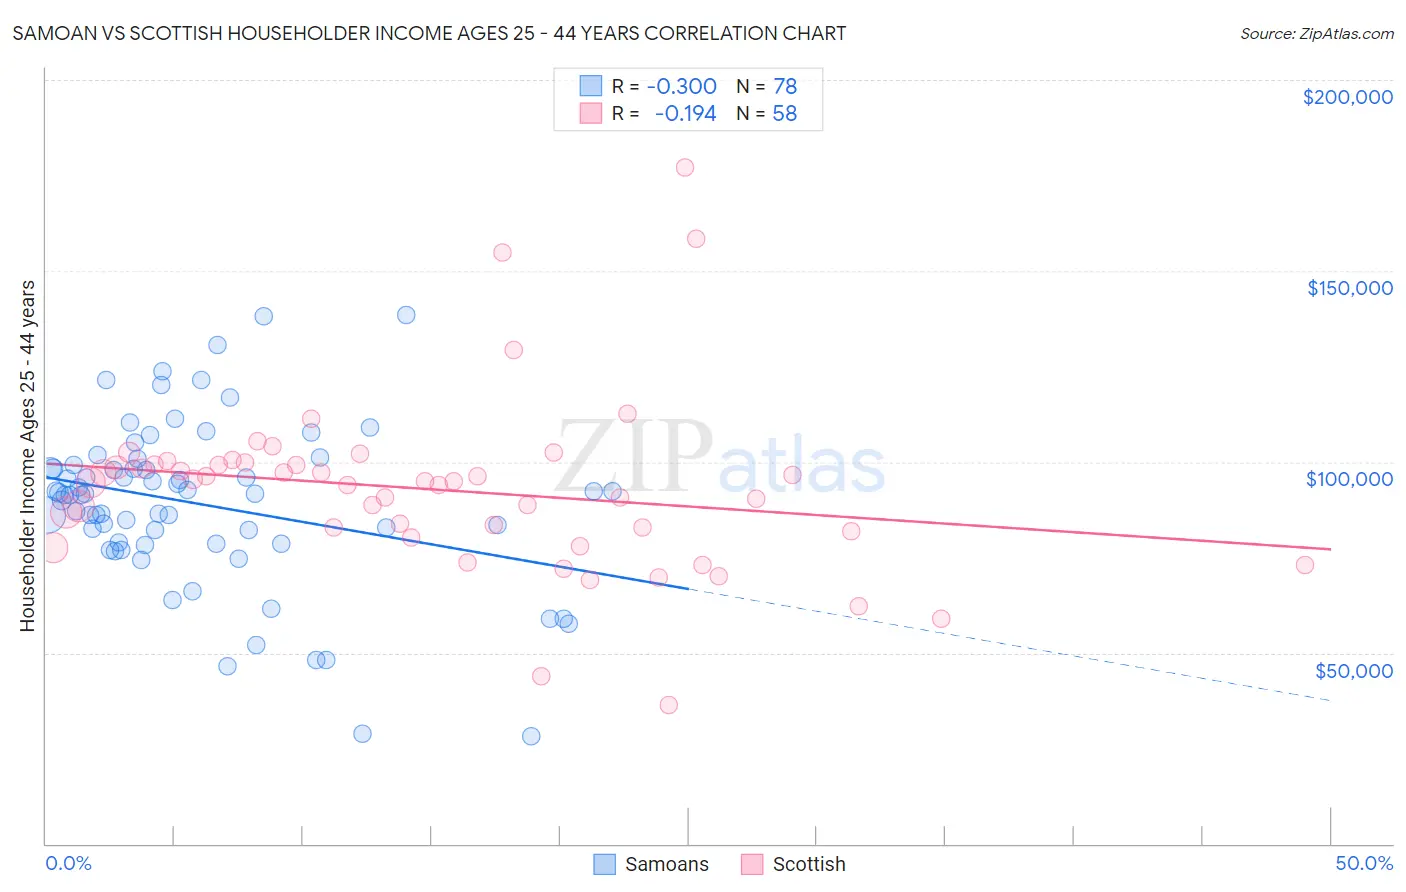
Samoan vs Scottish Householder Income Ages 25 - 44 years Correlation Chart
The statistical analysis conducted on geographies consisting of 224,893,183 people shows a mild negative correlation between the proportion of Samoans and household income with householder between the ages 25 and 44 in the United States with a correlation coefficient (R) of -0.300 and weighted average of $92,385. Similarly, the statistical analysis conducted on geographies consisting of 561,360,199 people shows a poor negative correlation between the proportion of Scottish and household income with householder between the ages 25 and 44 in the United States with a correlation coefficient (R) of -0.194 and weighted average of $94,622, a difference of 2.4%.
Householder Income Ages 25 - 44 years Correlation Summary
| Measurement | Samoan | Scottish |
| Minimum | $28,250 | $36,186 |
| Maximum | $138,313 | $177,052 |
| Range | $110,063 | $140,866 |
| Mean | $88,852 | $92,714 |
| Median | $91,500 | $94,762 |
| Interquartile 25% (IQ1) | $78,594 | $81,966 |
| Interquartile 75% (IQ3) | $98,319 | $99,308 |
| Interquartile Range (IQR) | $19,725 | $17,342 |
| Standard Deviation (Sample) | $21,577 | $23,114 |
| Standard Deviation (Population) | $21,438 | $22,914 |
Similar Demographics by Householder Income Ages 25 - 44 years
Demographics Similar to Samoans by Householder Income Ages 25 - 44 years
In terms of householder income ages 25 - 44 years, the demographic groups most similar to Samoans are Immigrants from the Azores ($92,322, a difference of 0.070%), Celtic ($92,241, a difference of 0.16%), Immigrants from Colombia ($92,204, a difference of 0.20%), Spanish ($92,200, a difference of 0.20%), and Vietnamese ($92,089, a difference of 0.32%).
| Demographics | Rating | Rank | Householder Income Ages 25 - 44 years |
| Sierra Leoneans | 34.8 /100 | #186 | Fair $93,435 |
| Spaniards | 34.0 /100 | #187 | Fair $93,366 |
| Immigrants | Sierra Leone | 30.9 /100 | #188 | Fair $93,115 |
| Dutch | 30.5 /100 | #189 | Fair $93,081 |
| Welsh | 30.0 /100 | #190 | Fair $93,039 |
| Tlingit-Haida | 29.4 /100 | #191 | Fair $92,987 |
| Immigrants | Costa Rica | 28.2 /100 | #192 | Fair $92,876 |
| Samoans | 23.0 /100 | #193 | Fair $92,385 |
| Immigrants | Azores | 22.4 /100 | #194 | Fair $92,322 |
| Celtics | 21.6 /100 | #195 | Fair $92,241 |
| Immigrants | Colombia | 21.3 /100 | #196 | Fair $92,204 |
| Spanish | 21.2 /100 | #197 | Fair $92,200 |
| Vietnamese | 20.2 /100 | #198 | Fair $92,089 |
| Kenyans | 16.8 /100 | #199 | Poor $91,684 |
| Whites/Caucasians | 16.7 /100 | #200 | Poor $91,668 |
Demographics Similar to Scottish by Householder Income Ages 25 - 44 years
In terms of householder income ages 25 - 44 years, the demographic groups most similar to Scottish are Finnish ($94,610, a difference of 0.010%), Colombian ($94,565, a difference of 0.060%), English ($94,429, a difference of 0.21%), Immigrants ($94,423, a difference of 0.21%), and Immigrants from Armenia ($94,867, a difference of 0.26%).
| Demographics | Rating | Rank | Householder Income Ages 25 - 44 years |
| Immigrants | Nepal | 60.3 /100 | #165 | Good $95,322 |
| Immigrants | Ethiopia | 59.5 /100 | #166 | Average $95,256 |
| Czechoslovakians | 57.0 /100 | #167 | Average $95,070 |
| Alsatians | 56.8 /100 | #168 | Average $95,059 |
| Native Hawaiians | 56.8 /100 | #169 | Average $95,058 |
| Slovaks | 56.4 /100 | #170 | Average $95,032 |
| Immigrants | Armenia | 54.2 /100 | #171 | Average $94,867 |
| Scottish | 50.8 /100 | #172 | Average $94,622 |
| Finns | 50.6 /100 | #173 | Average $94,610 |
| Colombians | 50.0 /100 | #174 | Average $94,565 |
| English | 48.1 /100 | #175 | Average $94,429 |
| Immigrants | Immigrants | 48.0 /100 | #176 | Average $94,423 |
| Belgians | 45.8 /100 | #177 | Average $94,262 |
| Immigrants | South America | 42.8 /100 | #178 | Average $94,042 |
| French Canadians | 38.2 /100 | #179 | Fair $93,694 |