Jamaican vs Scottish Householder Income Under 25 years
COMPARE
Jamaican
Scottish
Householder Income Under 25 years
Householder Income Under 25 years Comparison
Jamaicans
Scottish
$50,929
HOUSEHOLDER INCOME UNDER 25 YEARS
4.4/ 100
METRIC RATING
230th/ 347
METRIC RANK
$50,554
HOUSEHOLDER INCOME UNDER 25 YEARS
1.8/ 100
METRIC RATING
249th/ 347
METRIC RANK
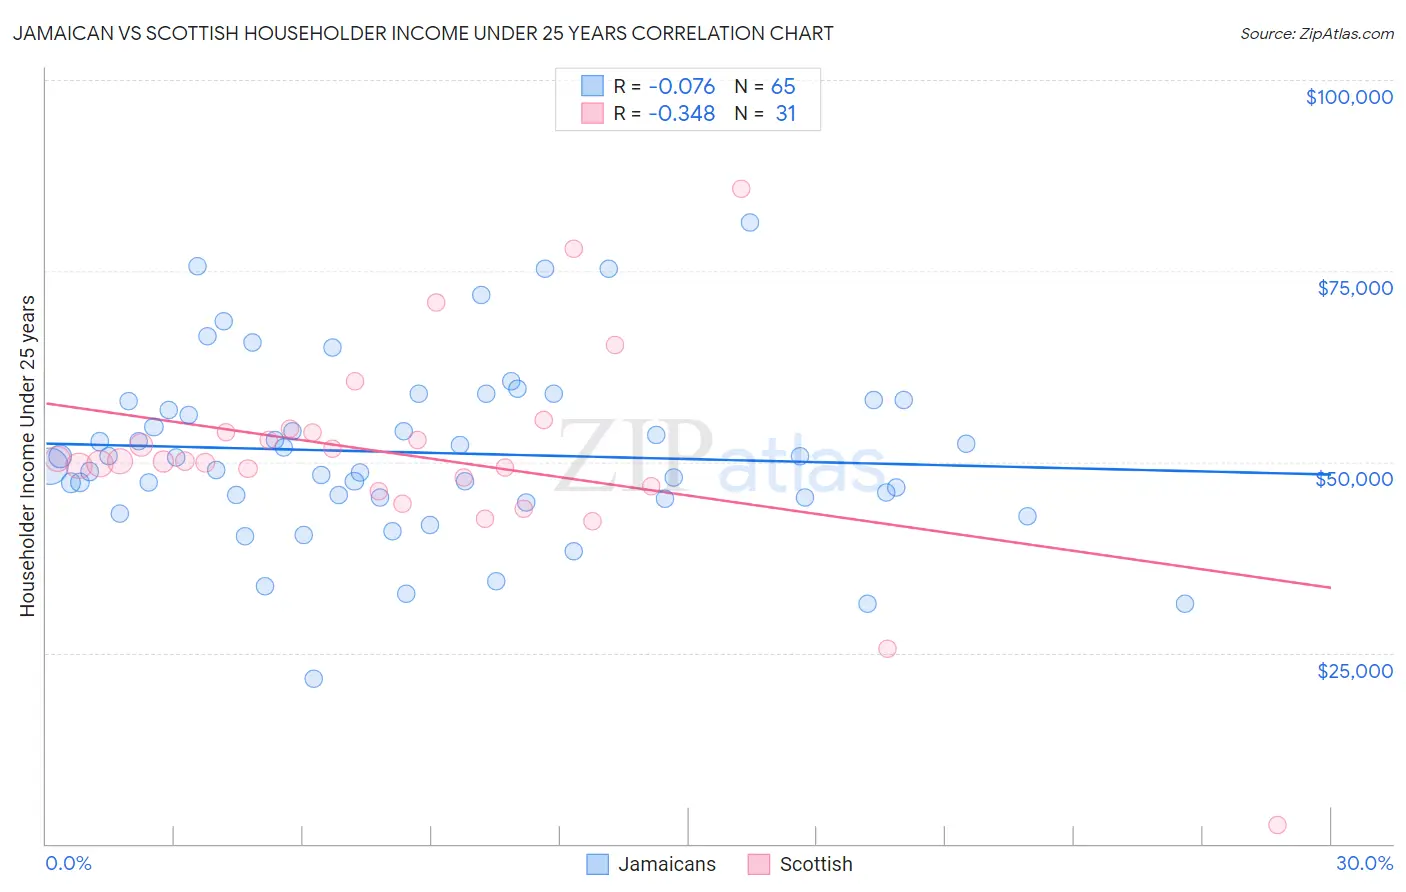
Jamaican vs Scottish Householder Income Under 25 years Correlation Chart
The statistical analysis conducted on geographies consisting of 311,962,738 people shows a slight negative correlation between the proportion of Jamaicans and household income with householder under the age of 25 in the United States with a correlation coefficient (R) of -0.076 and weighted average of $50,929. Similarly, the statistical analysis conducted on geographies consisting of 436,394,283 people shows a mild negative correlation between the proportion of Scottish and household income with householder under the age of 25 in the United States with a correlation coefficient (R) of -0.348 and weighted average of $50,554, a difference of 0.74%.
Householder Income Under 25 years Correlation Summary
| Measurement | Jamaican | Scottish |
| Minimum | $21,667 | $2,499 |
| Maximum | $81,354 | $85,781 |
| Range | $59,687 | $83,282 |
| Mean | $51,206 | $50,902 |
| Median | $50,597 | $50,084 |
| Interquartile 25% (IQ1) | $45,297 | $46,875 |
| Interquartile 75% (IQ3) | $58,010 | $53,902 |
| Interquartile Range (IQR) | $12,713 | $7,027 |
| Standard Deviation (Sample) | $11,380 | $14,135 |
| Standard Deviation (Population) | $11,292 | $13,905 |
Demographics Similar to Jamaicans and Scottish by Householder Income Under 25 years
In terms of householder income under 25 years, the demographic groups most similar to Jamaicans are Yuman ($50,933, a difference of 0.010%), Ugandan ($50,923, a difference of 0.010%), Slovene ($50,886, a difference of 0.080%), Pennsylvania German ($50,852, a difference of 0.15%), and Kenyan ($50,815, a difference of 0.23%). Similarly, the demographic groups most similar to Scottish are Immigrants from Bosnia and Herzegovina ($50,565, a difference of 0.020%), Slavic ($50,563, a difference of 0.020%), Welsh ($50,597, a difference of 0.090%), Immigrants from Africa ($50,609, a difference of 0.11%), and Marshallese ($50,627, a difference of 0.15%).
| Demographics | Rating | Rank | Householder Income Under 25 years |
| Yuman | 4.4 /100 | #229 | Tragic $50,933 |
| Jamaicans | 4.4 /100 | #230 | Tragic $50,929 |
| Ugandans | 4.3 /100 | #231 | Tragic $50,923 |
| Slovenes | 4.0 /100 | #232 | Tragic $50,886 |
| Pennsylvania Germans | 3.7 /100 | #233 | Tragic $50,852 |
| Kenyans | 3.3 /100 | #234 | Tragic $50,815 |
| Spanish | 3.3 /100 | #235 | Tragic $50,813 |
| English | 3.3 /100 | #236 | Tragic $50,805 |
| Germans | 3.3 /100 | #237 | Tragic $50,804 |
| Iraqis | 3.2 /100 | #238 | Tragic $50,802 |
| Immigrants | Caribbean | 2.9 /100 | #239 | Tragic $50,757 |
| Immigrants | Lebanon | 2.7 /100 | #240 | Tragic $50,729 |
| Immigrants | Micronesia | 2.5 /100 | #241 | Tragic $50,691 |
| Cubans | 2.3 /100 | #242 | Tragic $50,655 |
| Immigrants | Thailand | 2.2 /100 | #243 | Tragic $50,645 |
| Marshallese | 2.1 /100 | #244 | Tragic $50,627 |
| Immigrants | Africa | 2.0 /100 | #245 | Tragic $50,609 |
| Welsh | 2.0 /100 | #246 | Tragic $50,597 |
| Immigrants | Bosnia and Herzegovina | 1.8 /100 | #247 | Tragic $50,565 |
| Slavs | 1.8 /100 | #248 | Tragic $50,563 |
| Scottish | 1.8 /100 | #249 | Tragic $50,554 |