Immigrants from Burma/Myanmar vs Immigrants from Nicaragua Householder Income Under 25 years
COMPARE
Immigrants from Burma/Myanmar
Immigrants from Nicaragua
Householder Income Under 25 years
Householder Income Under 25 years Comparison
Immigrants from Burma/Myanmar
Immigrants from Nicaragua
$48,749
HOUSEHOLDER INCOME UNDER 25 YEARS
0.0/ 100
METRIC RATING
291st/ 347
METRIC RANK
$53,266
HOUSEHOLDER INCOME UNDER 25 YEARS
93.3/ 100
METRIC RATING
131st/ 347
METRIC RANK
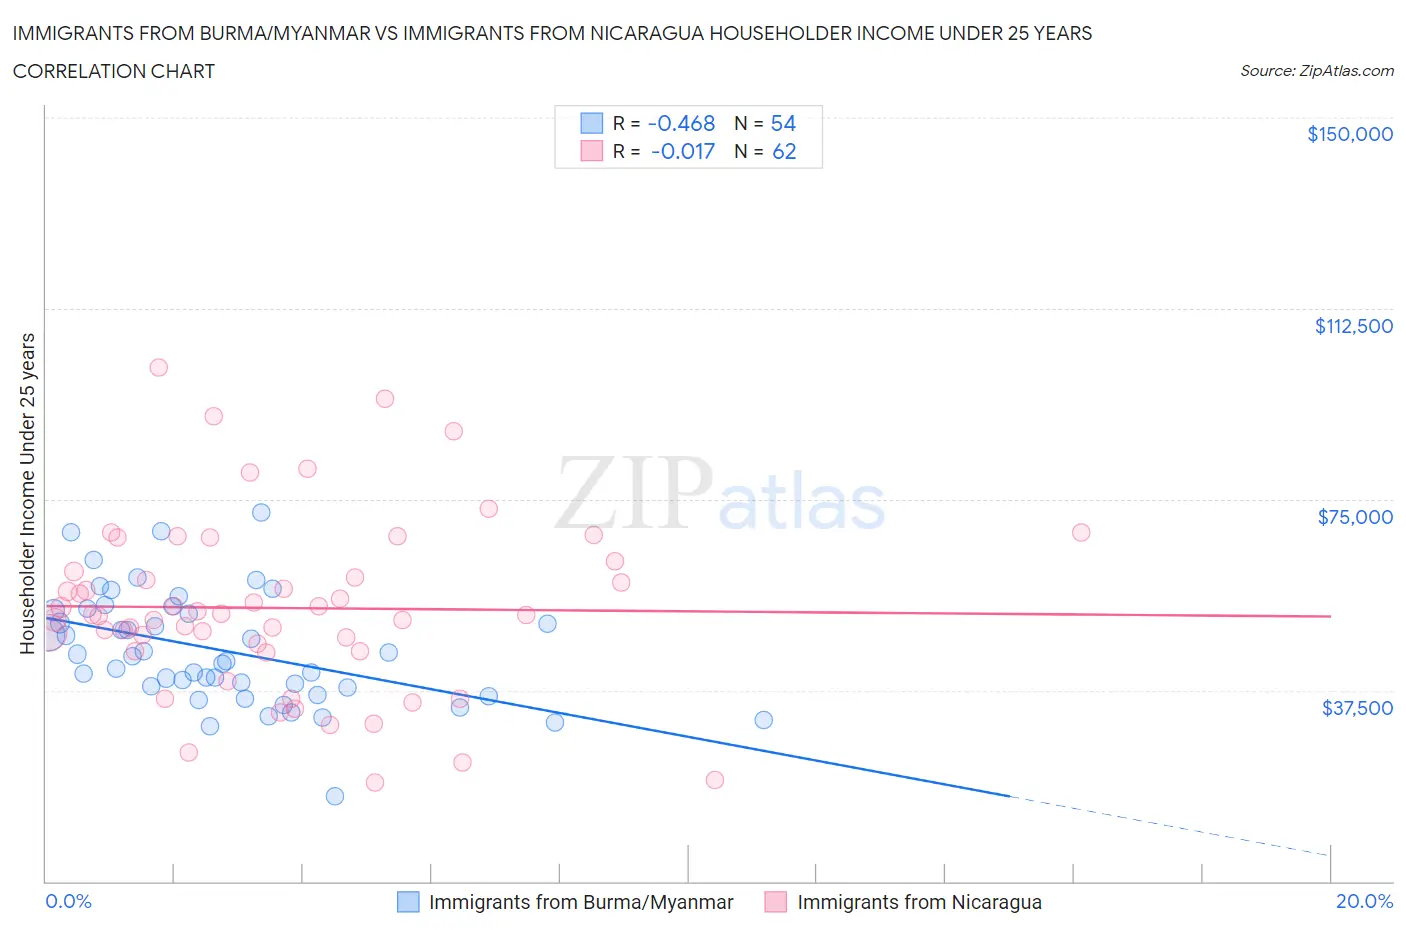
Immigrants from Burma/Myanmar vs Immigrants from Nicaragua Householder Income Under 25 years Correlation Chart
The statistical analysis conducted on geographies consisting of 158,147,131 people shows a moderate negative correlation between the proportion of Immigrants from Burma/Myanmar and household income with householder under the age of 25 in the United States with a correlation coefficient (R) of -0.468 and weighted average of $48,749. Similarly, the statistical analysis conducted on geographies consisting of 209,989,839 people shows no correlation between the proportion of Immigrants from Nicaragua and household income with householder under the age of 25 in the United States with a correlation coefficient (R) of -0.017 and weighted average of $53,266, a difference of 9.3%.
Householder Income Under 25 years Correlation Summary
| Measurement | Immigrants from Burma/Myanmar | Immigrants from Nicaragua |
| Minimum | $16,806 | $19,455 |
| Maximum | $72,545 | $100,948 |
| Range | $55,739 | $81,493 |
| Mean | $45,291 | $53,656 |
| Median | $43,645 | $52,382 |
| Interquartile 25% (IQ1) | $37,955 | $45,288 |
| Interquartile 75% (IQ3) | $53,234 | $60,822 |
| Interquartile Range (IQR) | $15,279 | $15,534 |
| Standard Deviation (Sample) | $11,040 | $17,142 |
| Standard Deviation (Population) | $10,937 | $17,003 |
Similar Demographics by Householder Income Under 25 years
Demographics Similar to Immigrants from Burma/Myanmar by Householder Income Under 25 years
In terms of householder income under 25 years, the demographic groups most similar to Immigrants from Burma/Myanmar are Shoshone ($48,720, a difference of 0.060%), Subsaharan African ($48,691, a difference of 0.12%), Somali ($48,657, a difference of 0.19%), Central American Indian ($48,643, a difference of 0.22%), and American ($48,860, a difference of 0.23%).
| Demographics | Rating | Rank | Householder Income Under 25 years |
| Carpatho Rusyns | 0.1 /100 | #284 | Tragic $49,113 |
| Scotch-Irish | 0.0 /100 | #285 | Tragic $49,039 |
| French American Indians | 0.0 /100 | #286 | Tragic $48,977 |
| Senegalese | 0.0 /100 | #287 | Tragic $48,953 |
| Liberians | 0.0 /100 | #288 | Tragic $48,917 |
| Hondurans | 0.0 /100 | #289 | Tragic $48,885 |
| Americans | 0.0 /100 | #290 | Tragic $48,860 |
| Immigrants | Burma/Myanmar | 0.0 /100 | #291 | Tragic $48,749 |
| Shoshone | 0.0 /100 | #292 | Tragic $48,720 |
| Sub-Saharan Africans | 0.0 /100 | #293 | Tragic $48,691 |
| Somalis | 0.0 /100 | #294 | Tragic $48,657 |
| Central American Indians | 0.0 /100 | #295 | Tragic $48,643 |
| Blackfeet | 0.0 /100 | #296 | Tragic $48,603 |
| Cree | 0.0 /100 | #297 | Tragic $48,514 |
| Yaqui | 0.0 /100 | #298 | Tragic $48,300 |
Demographics Similar to Immigrants from Nicaragua by Householder Income Under 25 years
In terms of householder income under 25 years, the demographic groups most similar to Immigrants from Nicaragua are Nicaraguan ($53,275, a difference of 0.020%), Moroccan ($53,256, a difference of 0.020%), New Zealander ($53,294, a difference of 0.050%), Immigrants from Bulgaria ($53,305, a difference of 0.070%), and Immigrants from North America ($53,307, a difference of 0.080%).
| Demographics | Rating | Rank | Householder Income Under 25 years |
| Colombians | 94.6 /100 | #124 | Exceptional $53,357 |
| Pakistanis | 94.1 /100 | #125 | Exceptional $53,325 |
| Immigrants | Serbia | 94.1 /100 | #126 | Exceptional $53,321 |
| Immigrants | North America | 93.9 /100 | #127 | Exceptional $53,307 |
| Immigrants | Bulgaria | 93.9 /100 | #128 | Exceptional $53,305 |
| New Zealanders | 93.7 /100 | #129 | Exceptional $53,294 |
| Nicaraguans | 93.4 /100 | #130 | Exceptional $53,275 |
| Immigrants | Nicaragua | 93.3 /100 | #131 | Exceptional $53,266 |
| Moroccans | 93.1 /100 | #132 | Exceptional $53,256 |
| Immigrants | Immigrants | 92.2 /100 | #133 | Exceptional $53,201 |
| Immigrants | Northern Africa | 91.9 /100 | #134 | Exceptional $53,185 |
| Chileans | 91.9 /100 | #135 | Exceptional $53,185 |
| Armenians | 91.8 /100 | #136 | Exceptional $53,179 |
| Immigrants | Barbados | 91.5 /100 | #137 | Exceptional $53,163 |
| Norwegians | 90.8 /100 | #138 | Exceptional $53,127 |