Spanish vs Malaysian Householder Income Ages 25 - 44 years
COMPARE
Spanish
Malaysian
Householder Income Ages 25 - 44 years
Householder Income Ages 25 - 44 years Comparison
Spanish
Malaysians
$92,200
HOUSEHOLDER INCOME AGES 25 - 44 YEARS
21.2/ 100
METRIC RATING
197th/ 347
METRIC RANK
$88,291
HOUSEHOLDER INCOME AGES 25 - 44 YEARS
3.0/ 100
METRIC RATING
233rd/ 347
METRIC RANK
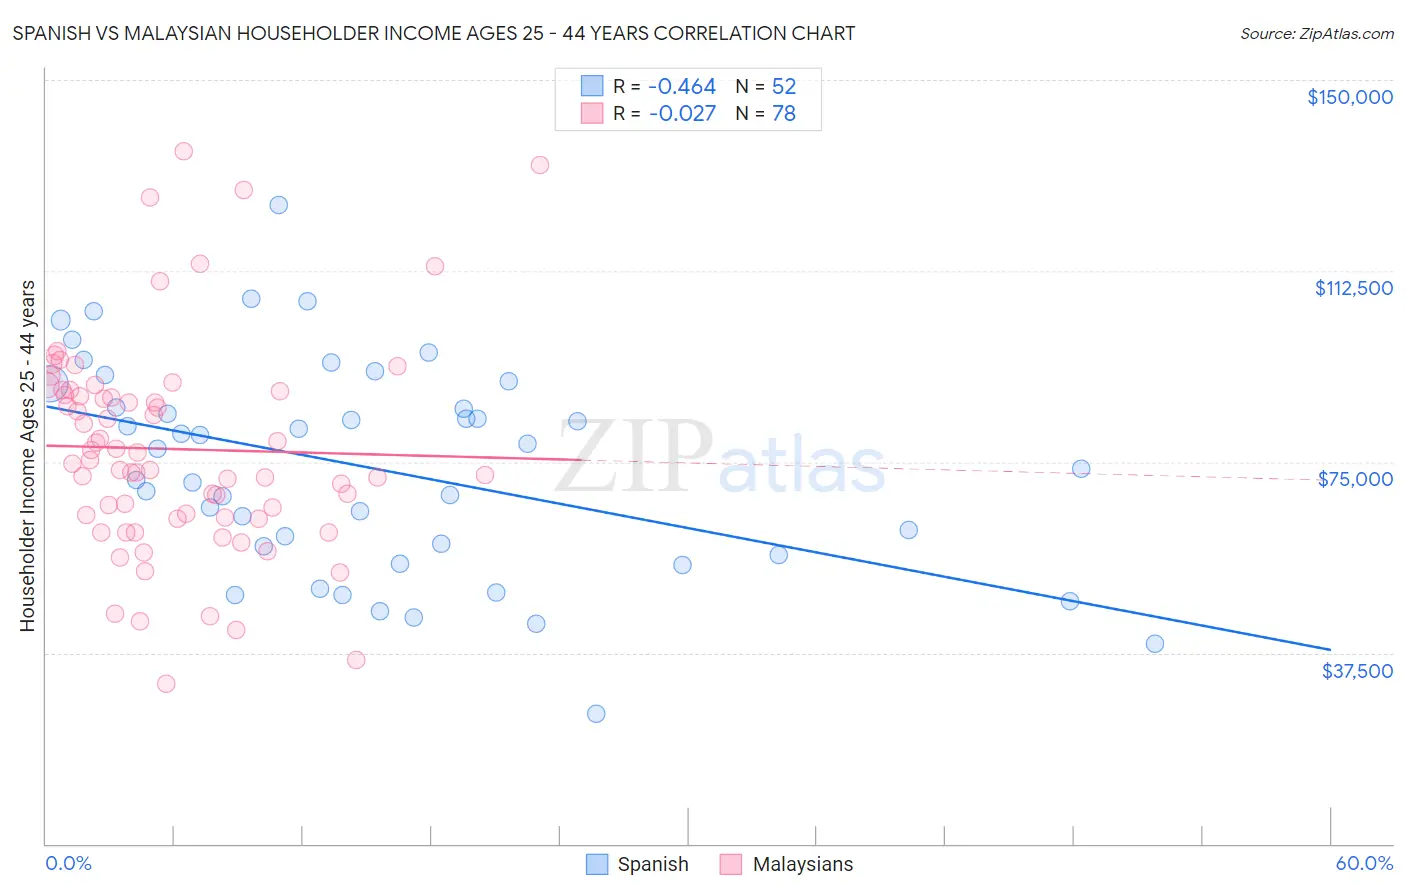
Spanish vs Malaysian Householder Income Ages 25 - 44 years Correlation Chart
The statistical analysis conducted on geographies consisting of 420,641,829 people shows a moderate negative correlation between the proportion of Spanish and household income with householder between the ages 25 and 44 in the United States with a correlation coefficient (R) of -0.464 and weighted average of $92,200. Similarly, the statistical analysis conducted on geographies consisting of 225,821,746 people shows no correlation between the proportion of Malaysians and household income with householder between the ages 25 and 44 in the United States with a correlation coefficient (R) of -0.027 and weighted average of $88,291, a difference of 4.4%.
Householder Income Ages 25 - 44 years Correlation Summary
| Measurement | Spanish | Malaysian |
| Minimum | $25,625 | $31,500 |
| Maximum | $125,388 | $135,944 |
| Range | $99,763 | $104,444 |
| Mean | $73,721 | $77,509 |
| Median | $75,712 | $74,995 |
| Interquartile 25% (IQ1) | $57,541 | $64,000 |
| Interquartile 75% (IQ3) | $88,040 | $88,750 |
| Interquartile Range (IQR) | $30,499 | $24,750 |
| Standard Deviation (Sample) | $20,894 | $20,820 |
| Standard Deviation (Population) | $20,692 | $20,686 |
Similar Demographics by Householder Income Ages 25 - 44 years
Demographics Similar to Spanish by Householder Income Ages 25 - 44 years
In terms of householder income ages 25 - 44 years, the demographic groups most similar to Spanish are Immigrants from Colombia ($92,204, a difference of 0.0%), Celtic ($92,241, a difference of 0.040%), Vietnamese ($92,089, a difference of 0.12%), Immigrants from the Azores ($92,322, a difference of 0.13%), and Samoan ($92,385, a difference of 0.20%).
| Demographics | Rating | Rank | Householder Income Ages 25 - 44 years |
| Welsh | 30.0 /100 | #190 | Fair $93,039 |
| Tlingit-Haida | 29.4 /100 | #191 | Fair $92,987 |
| Immigrants | Costa Rica | 28.2 /100 | #192 | Fair $92,876 |
| Samoans | 23.0 /100 | #193 | Fair $92,385 |
| Immigrants | Azores | 22.4 /100 | #194 | Fair $92,322 |
| Celtics | 21.6 /100 | #195 | Fair $92,241 |
| Immigrants | Colombia | 21.3 /100 | #196 | Fair $92,204 |
| Spanish | 21.2 /100 | #197 | Fair $92,200 |
| Vietnamese | 20.2 /100 | #198 | Fair $92,089 |
| Kenyans | 16.8 /100 | #199 | Poor $91,684 |
| Whites/Caucasians | 16.7 /100 | #200 | Poor $91,668 |
| Japanese | 16.4 /100 | #201 | Poor $91,624 |
| Ecuadorians | 16.0 /100 | #202 | Poor $91,574 |
| Immigrants | Cambodia | 15.7 /100 | #203 | Poor $91,533 |
| Nepalese | 15.4 /100 | #204 | Poor $91,498 |
Demographics Similar to Malaysians by Householder Income Ages 25 - 44 years
In terms of householder income ages 25 - 44 years, the demographic groups most similar to Malaysians are Nonimmigrants ($88,301, a difference of 0.010%), Immigrants from Grenada ($88,311, a difference of 0.020%), Venezuelan ($88,232, a difference of 0.070%), Bermudan ($88,231, a difference of 0.070%), and Immigrants from Cameroon ($88,214, a difference of 0.090%).
| Demographics | Rating | Rank | Householder Income Ages 25 - 44 years |
| Immigrants | Iraq | 5.5 /100 | #226 | Tragic $89,444 |
| Immigrants | St. Vincent and the Grenadines | 4.1 /100 | #227 | Tragic $88,888 |
| Immigrants | Bosnia and Herzegovina | 4.0 /100 | #228 | Tragic $88,819 |
| Immigrants | Barbados | 3.7 /100 | #229 | Tragic $88,687 |
| Alaskan Athabascans | 3.3 /100 | #230 | Tragic $88,446 |
| Immigrants | Grenada | 3.0 /100 | #231 | Tragic $88,311 |
| Immigrants | Nonimmigrants | 3.0 /100 | #232 | Tragic $88,301 |
| Malaysians | 3.0 /100 | #233 | Tragic $88,291 |
| Venezuelans | 2.9 /100 | #234 | Tragic $88,232 |
| Bermudans | 2.9 /100 | #235 | Tragic $88,231 |
| Immigrants | Cameroon | 2.9 /100 | #236 | Tragic $88,214 |
| Salvadorans | 2.8 /100 | #237 | Tragic $88,198 |
| Alaska Natives | 2.6 /100 | #238 | Tragic $88,018 |
| Immigrants | Ghana | 2.2 /100 | #239 | Tragic $87,760 |
| Nicaraguans | 2.2 /100 | #240 | Tragic $87,751 |