Immigrants from South Eastern Asia vs Immigrants from Mexico Householder Income Ages 25 - 44 years
COMPARE
Immigrants from South Eastern Asia
Immigrants from Mexico
Householder Income Ages 25 - 44 years
Householder Income Ages 25 - 44 years Comparison
Immigrants from South Eastern Asia
Immigrants from Mexico
$100,283
HOUSEHOLDER INCOME AGES 25 - 44 YEARS
96.0/ 100
METRIC RATING
108th/ 347
METRIC RANK
$78,809
HOUSEHOLDER INCOME AGES 25 - 44 YEARS
0.0/ 100
METRIC RATING
318th/ 347
METRIC RANK
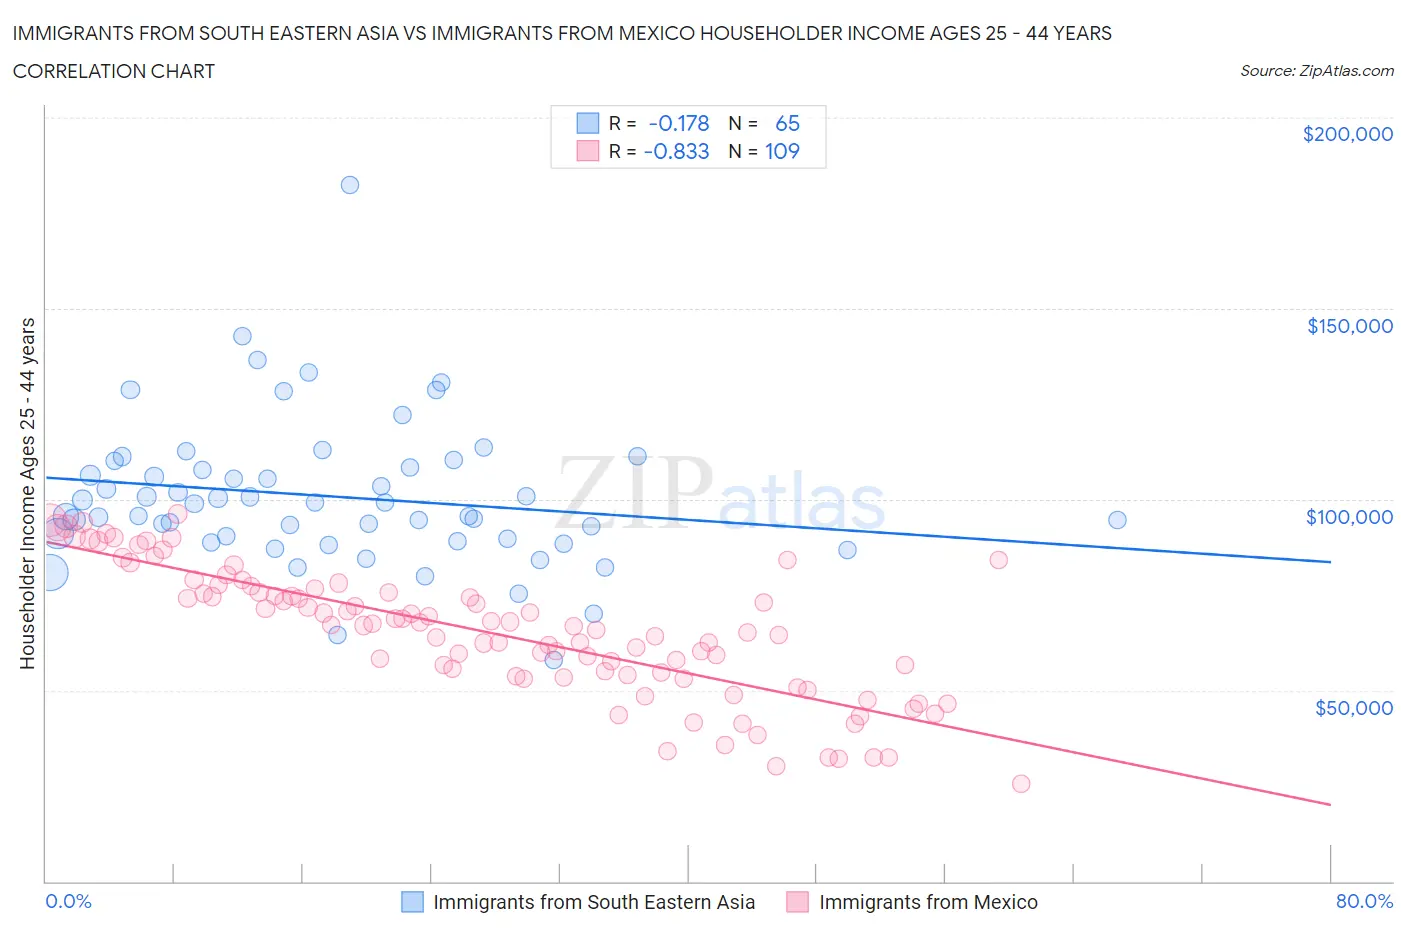
Immigrants from South Eastern Asia vs Immigrants from Mexico Householder Income Ages 25 - 44 years Correlation Chart
The statistical analysis conducted on geographies consisting of 510,148,738 people shows a poor negative correlation between the proportion of Immigrants from South Eastern Asia and household income with householder between the ages 25 and 44 in the United States with a correlation coefficient (R) of -0.178 and weighted average of $100,283. Similarly, the statistical analysis conducted on geographies consisting of 510,586,481 people shows a very strong negative correlation between the proportion of Immigrants from Mexico and household income with householder between the ages 25 and 44 in the United States with a correlation coefficient (R) of -0.833 and weighted average of $78,809, a difference of 27.3%.
Householder Income Ages 25 - 44 years Correlation Summary
| Measurement | Immigrants from South Eastern Asia | Immigrants from Mexico |
| Minimum | $57,917 | $25,500 |
| Maximum | $182,472 | $96,265 |
| Range | $124,555 | $70,765 |
| Mean | $100,791 | $65,144 |
| Median | $98,946 | $66,989 |
| Interquartile 25% (IQ1) | $89,392 | $53,834 |
| Interquartile 75% (IQ3) | $109,276 | $76,158 |
| Interquartile Range (IQR) | $19,885 | $22,324 |
| Standard Deviation (Sample) | $19,414 | $16,884 |
| Standard Deviation (Population) | $19,264 | $16,806 |
Similar Demographics by Householder Income Ages 25 - 44 years
Demographics Similar to Immigrants from South Eastern Asia by Householder Income Ages 25 - 44 years
In terms of householder income ages 25 - 44 years, the demographic groups most similar to Immigrants from South Eastern Asia are Northern European ($100,457, a difference of 0.17%), Immigrants from North Macedonia ($100,101, a difference of 0.18%), Immigrants from Vietnam ($100,535, a difference of 0.25%), Immigrants from Brazil ($100,534, a difference of 0.25%), and Immigrants from Afghanistan ($99,977, a difference of 0.31%).
| Demographics | Rating | Rank | Householder Income Ages 25 - 44 years |
| Albanians | 97.8 /100 | #101 | Exceptional $101,367 |
| Immigrants | Lebanon | 97.4 /100 | #102 | Exceptional $101,124 |
| Immigrants | Moldova | 97.4 /100 | #103 | Exceptional $101,091 |
| Immigrants | Poland | 97.4 /100 | #104 | Exceptional $101,065 |
| Immigrants | Vietnam | 96.5 /100 | #105 | Exceptional $100,535 |
| Immigrants | Brazil | 96.5 /100 | #106 | Exceptional $100,534 |
| Northern Europeans | 96.3 /100 | #107 | Exceptional $100,457 |
| Immigrants | South Eastern Asia | 96.0 /100 | #108 | Exceptional $100,283 |
| Immigrants | North Macedonia | 95.6 /100 | #109 | Exceptional $100,101 |
| Immigrants | Afghanistan | 95.3 /100 | #110 | Exceptional $99,977 |
| Chileans | 95.1 /100 | #111 | Exceptional $99,900 |
| Poles | 94.5 /100 | #112 | Exceptional $99,685 |
| Tongans | 94.2 /100 | #113 | Exceptional $99,604 |
| Immigrants | Western Asia | 94.0 /100 | #114 | Exceptional $99,516 |
| Carpatho Rusyns | 93.7 /100 | #115 | Exceptional $99,449 |
Demographics Similar to Immigrants from Mexico by Householder Income Ages 25 - 44 years
In terms of householder income ages 25 - 44 years, the demographic groups most similar to Immigrants from Mexico are U.S. Virgin Islander ($78,911, a difference of 0.13%), African ($78,986, a difference of 0.22%), Ottawa ($79,012, a difference of 0.26%), Honduran ($78,540, a difference of 0.34%), and Cheyenne ($79,152, a difference of 0.44%).
| Demographics | Rating | Rank | Householder Income Ages 25 - 44 years |
| Indonesians | 0.0 /100 | #311 | Tragic $79,543 |
| Immigrants | Haiti | 0.0 /100 | #312 | Tragic $79,391 |
| Menominee | 0.0 /100 | #313 | Tragic $79,358 |
| Cheyenne | 0.0 /100 | #314 | Tragic $79,152 |
| Ottawa | 0.0 /100 | #315 | Tragic $79,012 |
| Africans | 0.0 /100 | #316 | Tragic $78,986 |
| U.S. Virgin Islanders | 0.0 /100 | #317 | Tragic $78,911 |
| Immigrants | Mexico | 0.0 /100 | #318 | Tragic $78,809 |
| Hondurans | 0.0 /100 | #319 | Tragic $78,540 |
| Choctaw | 0.0 /100 | #320 | Tragic $78,168 |
| Immigrants | Zaire | 0.0 /100 | #321 | Tragic $78,045 |
| Chickasaw | 0.0 /100 | #322 | Tragic $77,929 |
| Immigrants | Honduras | 0.0 /100 | #323 | Tragic $77,328 |
| Dutch West Indians | 0.0 /100 | #324 | Tragic $77,260 |
| Sioux | 0.0 /100 | #325 | Tragic $77,089 |