Immigrants from Bosnia and Herzegovina vs Immigrants from Mexico Family Households
COMPARE
Immigrants from Bosnia and Herzegovina
Immigrants from Mexico
Family Households
Family Households Comparison
Immigrants from Bosnia and Herzegovina
Immigrants from Mexico
61.9%
FAMILY HOUSEHOLDS
0.0/ 100
METRIC RATING
317th/ 347
METRIC RANK
69.1%
FAMILY HOUSEHOLDS
100.0/ 100
METRIC RATING
6th/ 347
METRIC RANK
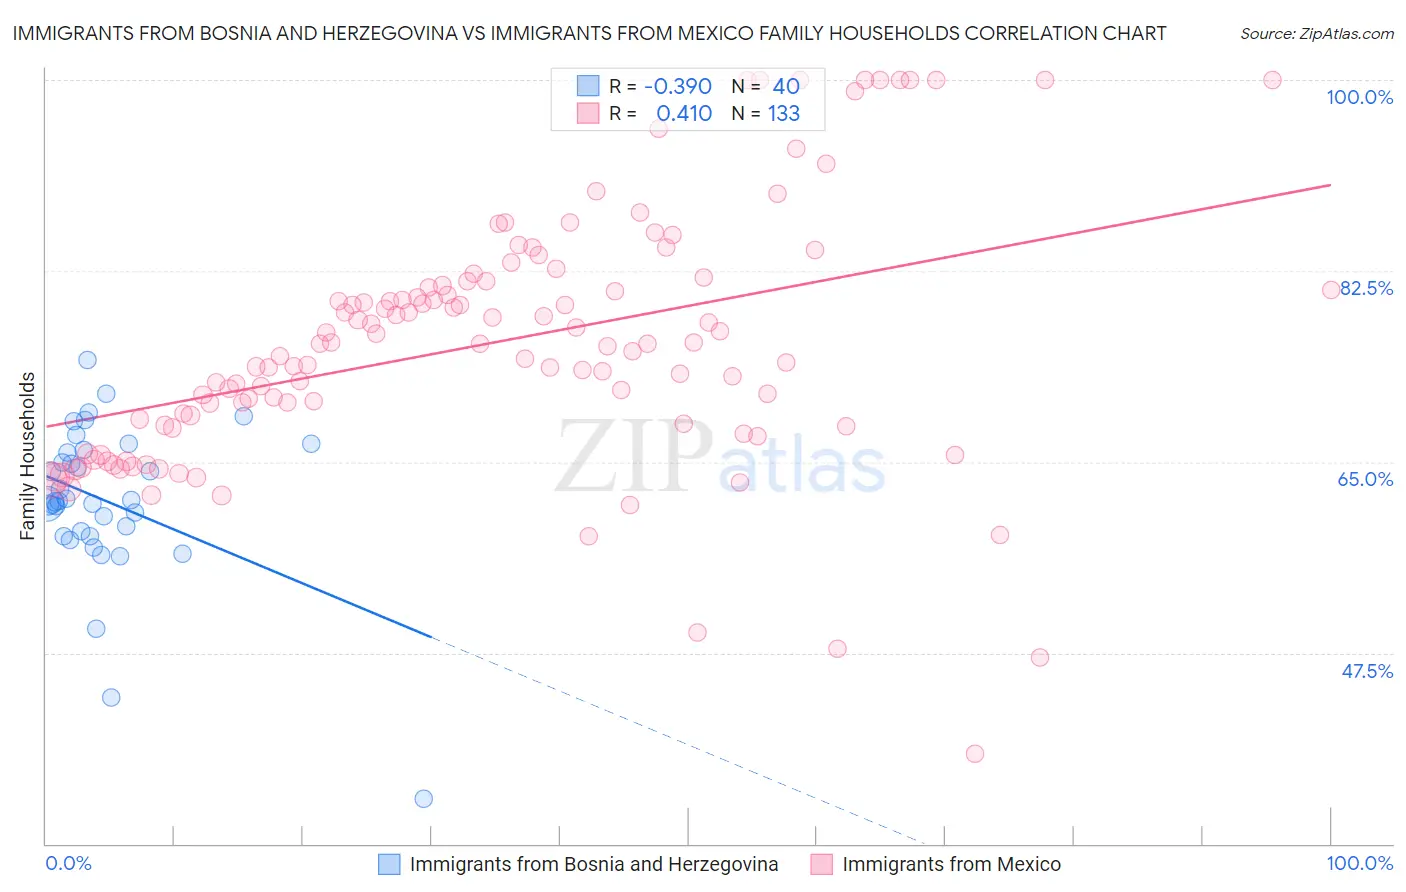
Immigrants from Bosnia and Herzegovina vs Immigrants from Mexico Family Households Correlation Chart
The statistical analysis conducted on geographies consisting of 156,805,510 people shows a mild negative correlation between the proportion of Immigrants from Bosnia and Herzegovina and percentage of family households in the United States with a correlation coefficient (R) of -0.390 and weighted average of 61.9%. Similarly, the statistical analysis conducted on geographies consisting of 513,403,563 people shows a moderate positive correlation between the proportion of Immigrants from Mexico and percentage of family households in the United States with a correlation coefficient (R) of 0.410 and weighted average of 69.1%, a difference of 11.7%.
Family Households Correlation Summary
| Measurement | Immigrants from Bosnia and Herzegovina | Immigrants from Mexico |
| Minimum | 34.1% | 38.2% |
| Maximum | 74.3% | 100.0% |
| Range | 40.2% | 61.8% |
| Mean | 61.4% | 75.8% |
| Median | 61.4% | 75.8% |
| Interquartile 25% (IQ1) | 58.4% | 68.3% |
| Interquartile 75% (IQ3) | 65.9% | 81.4% |
| Interquartile Range (IQR) | 7.5% | 13.1% |
| Standard Deviation (Sample) | 7.2% | 11.6% |
| Standard Deviation (Population) | 7.1% | 11.6% |
Similar Demographics by Family Households
Demographics Similar to Immigrants from Bosnia and Herzegovina by Family Households
In terms of family households, the demographic groups most similar to Immigrants from Bosnia and Herzegovina are Immigrants from Middle Africa (61.9%, a difference of 0.040%), Moroccan (61.9%, a difference of 0.080%), Alaskan Athabascan (61.8%, a difference of 0.080%), Immigrants from Cabo Verde (61.9%, a difference of 0.13%), and Cape Verdean (61.8%, a difference of 0.14%).
| Demographics | Rating | Rank | Family Households |
| Immigrants | Liberia | 0.0 /100 | #310 | Tragic 62.0% |
| Immigrants | Morocco | 0.0 /100 | #311 | Tragic 62.0% |
| Immigrants | Latvia | 0.0 /100 | #312 | Tragic 62.0% |
| Liberians | 0.0 /100 | #313 | Tragic 62.0% |
| Immigrants | Cabo Verde | 0.0 /100 | #314 | Tragic 61.9% |
| Moroccans | 0.0 /100 | #315 | Tragic 61.9% |
| Immigrants | Middle Africa | 0.0 /100 | #316 | Tragic 61.9% |
| Immigrants | Bosnia and Herzegovina | 0.0 /100 | #317 | Tragic 61.9% |
| Alaskan Athabascans | 0.0 /100 | #318 | Tragic 61.8% |
| Cape Verdeans | 0.0 /100 | #319 | Tragic 61.8% |
| Ugandans | 0.0 /100 | #320 | Tragic 61.7% |
| Alsatians | 0.0 /100 | #321 | Tragic 61.7% |
| Immigrants | Serbia | 0.0 /100 | #322 | Tragic 61.6% |
| Tlingit-Haida | 0.0 /100 | #323 | Tragic 61.6% |
| Immigrants | West Indies | 0.0 /100 | #324 | Tragic 61.6% |
Demographics Similar to Immigrants from Mexico by Family Households
In terms of family households, the demographic groups most similar to Immigrants from Mexico are Mexican (69.0%, a difference of 0.21%), Yuman (69.3%, a difference of 0.24%), Yakama (69.3%, a difference of 0.26%), Immigrants from Fiji (68.8%, a difference of 0.53%), and Tongan (69.6%, a difference of 0.71%).
| Demographics | Rating | Rank | Family Households |
| Yup'ik | 100 /100 | #1 | Exceptional 72.4% |
| Spanish American Indians | 100.0 /100 | #2 | Exceptional 71.2% |
| Tongans | 100.0 /100 | #3 | Exceptional 69.6% |
| Yakama | 100.0 /100 | #4 | Exceptional 69.3% |
| Yuman | 100.0 /100 | #5 | Exceptional 69.3% |
| Immigrants | Mexico | 100.0 /100 | #6 | Exceptional 69.1% |
| Mexicans | 100.0 /100 | #7 | Exceptional 69.0% |
| Immigrants | Fiji | 100.0 /100 | #8 | Exceptional 68.8% |
| Native Hawaiians | 100.0 /100 | #9 | Exceptional 68.4% |
| Immigrants | Philippines | 100.0 /100 | #10 | Exceptional 68.3% |
| Immigrants | Central America | 100.0 /100 | #11 | Exceptional 68.3% |
| Koreans | 100.0 /100 | #12 | Exceptional 68.3% |
| Pueblo | 100.0 /100 | #13 | Exceptional 68.2% |
| Immigrants | Cuba | 100.0 /100 | #14 | Exceptional 68.2% |
| Assyrians/Chaldeans/Syriacs | 100.0 /100 | #15 | Exceptional 68.2% |