Immigrants from Belgium vs Immigrants from Albania Householder Income Ages 45 - 64 years
COMPARE
Immigrants from Belgium
Immigrants from Albania
Householder Income Ages 45 - 64 years
Householder Income Ages 45 - 64 years Comparison
Immigrants from Belgium
Immigrants from Albania
$118,932
HOUSEHOLDER INCOME AGES 45 - 64 YEARS
100.0/ 100
METRIC RATING
22nd/ 347
METRIC RANK
$101,957
HOUSEHOLDER INCOME AGES 45 - 64 YEARS
69.4/ 100
METRIC RATING
165th/ 347
METRIC RANK
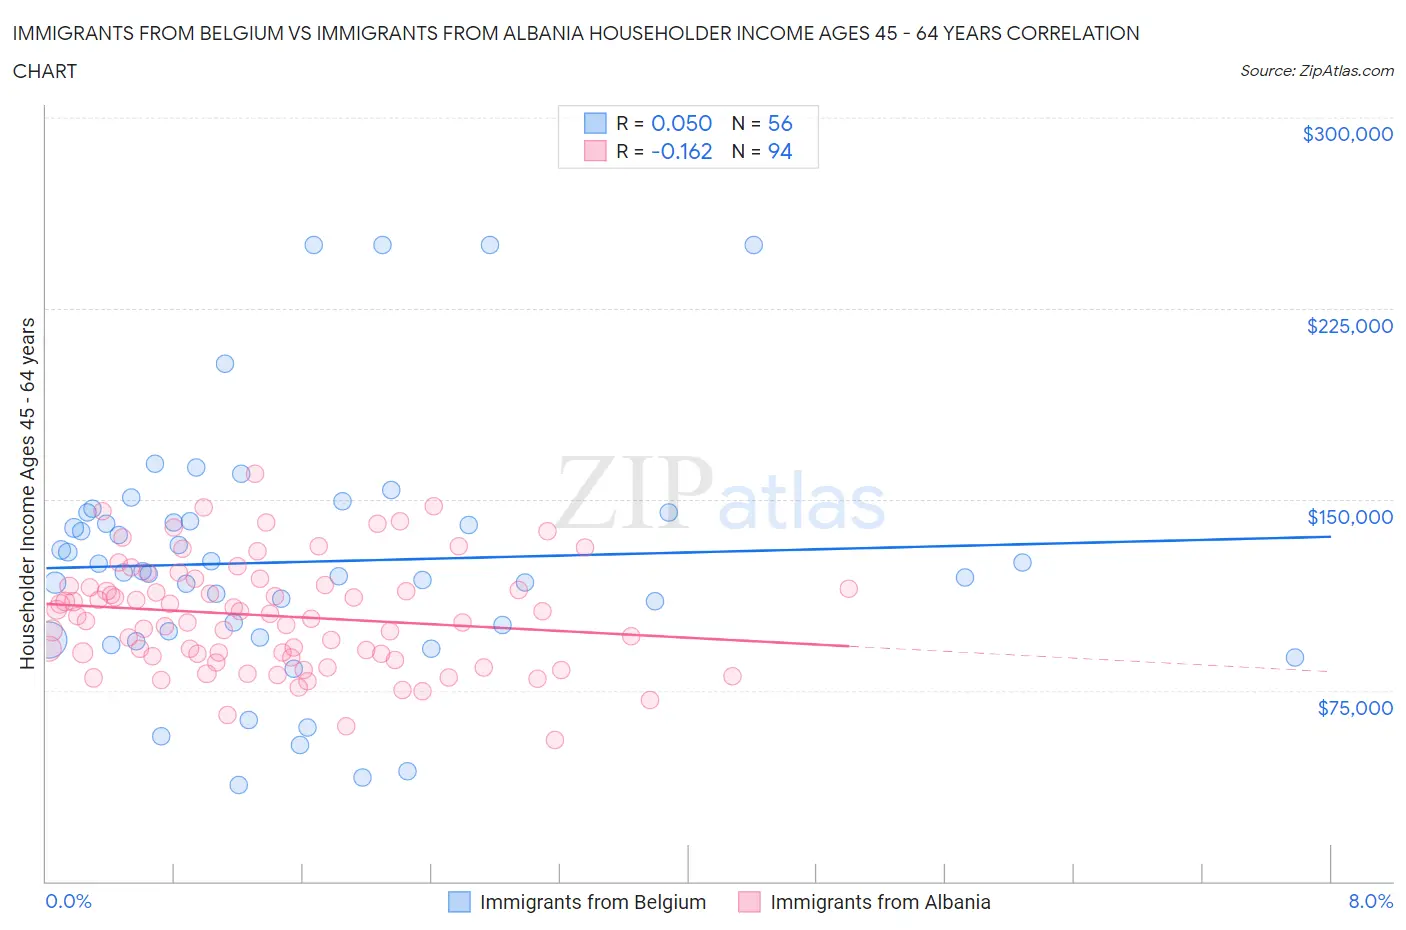
Immigrants from Belgium vs Immigrants from Albania Householder Income Ages 45 - 64 years Correlation Chart
The statistical analysis conducted on geographies consisting of 146,611,057 people shows a slight positive correlation between the proportion of Immigrants from Belgium and household income with householder between the ages 45 and 64 in the United States with a correlation coefficient (R) of 0.050 and weighted average of $118,932. Similarly, the statistical analysis conducted on geographies consisting of 119,310,676 people shows a poor negative correlation between the proportion of Immigrants from Albania and household income with householder between the ages 45 and 64 in the United States with a correlation coefficient (R) of -0.162 and weighted average of $101,957, a difference of 16.7%.
Householder Income Ages 45 - 64 years Correlation Summary
| Measurement | Immigrants from Belgium | Immigrants from Albania |
| Minimum | $38,026 | $55,673 |
| Maximum | $250,001 | $159,921 |
| Range | $211,975 | $104,248 |
| Mean | $125,440 | $104,200 |
| Median | $121,589 | $103,574 |
| Interquartile 25% (IQ1) | $96,886 | $88,350 |
| Interquartile 75% (IQ3) | $142,973 | $115,886 |
| Interquartile Range (IQR) | $46,087 | $27,536 |
| Standard Deviation (Sample) | $48,145 | $21,437 |
| Standard Deviation (Population) | $47,713 | $21,323 |
Similar Demographics by Householder Income Ages 45 - 64 years
Demographics Similar to Immigrants from Belgium by Householder Income Ages 45 - 64 years
In terms of householder income ages 45 - 64 years, the demographic groups most similar to Immigrants from Belgium are Bolivian ($118,871, a difference of 0.050%), Immigrants from Sri Lanka ($119,094, a difference of 0.14%), Immigrants from Australia ($119,308, a difference of 0.32%), Immigrants from Japan ($118,498, a difference of 0.37%), and Asian ($118,426, a difference of 0.43%).
| Demographics | Rating | Rank | Householder Income Ages 45 - 64 years |
| Immigrants | Eastern Asia | 100.0 /100 | #15 | Exceptional $122,222 |
| Immigrants | China | 100.0 /100 | #16 | Exceptional $122,178 |
| Burmese | 100.0 /100 | #17 | Exceptional $121,444 |
| Immigrants | Korea | 100.0 /100 | #18 | Exceptional $121,243 |
| Eastern Europeans | 100.0 /100 | #19 | Exceptional $120,684 |
| Immigrants | Australia | 100.0 /100 | #20 | Exceptional $119,308 |
| Immigrants | Sri Lanka | 100.0 /100 | #21 | Exceptional $119,094 |
| Immigrants | Belgium | 100.0 /100 | #22 | Exceptional $118,932 |
| Bolivians | 100.0 /100 | #23 | Exceptional $118,871 |
| Immigrants | Japan | 100.0 /100 | #24 | Exceptional $118,498 |
| Asians | 100.0 /100 | #25 | Exceptional $118,426 |
| Immigrants | Sweden | 100.0 /100 | #26 | Exceptional $118,318 |
| Immigrants | Northern Europe | 100.0 /100 | #27 | Exceptional $117,930 |
| Turks | 100.0 /100 | #28 | Exceptional $117,814 |
| Bhutanese | 100.0 /100 | #29 | Exceptional $117,750 |
Demographics Similar to Immigrants from Albania by Householder Income Ages 45 - 64 years
In terms of householder income ages 45 - 64 years, the demographic groups most similar to Immigrants from Albania are English ($102,021, a difference of 0.060%), Immigrants from Morocco ($102,015, a difference of 0.060%), Scottish ($102,123, a difference of 0.16%), Immigrants from Nepal ($102,190, a difference of 0.23%), and Icelander ($102,261, a difference of 0.30%).
| Demographics | Rating | Rank | Householder Income Ages 45 - 64 years |
| Slavs | 76.1 /100 | #158 | Good $102,629 |
| Sierra Leoneans | 74.2 /100 | #159 | Good $102,427 |
| Icelanders | 72.5 /100 | #160 | Good $102,261 |
| Immigrants | Nepal | 71.8 /100 | #161 | Good $102,190 |
| Scottish | 71.1 /100 | #162 | Good $102,123 |
| English | 70.1 /100 | #163 | Good $102,021 |
| Immigrants | Morocco | 70.0 /100 | #164 | Good $102,015 |
| Immigrants | Albania | 69.4 /100 | #165 | Good $101,957 |
| Samoans | 65.3 /100 | #166 | Good $101,580 |
| Czechoslovakians | 63.0 /100 | #167 | Good $101,387 |
| South American Indians | 60.5 /100 | #168 | Good $101,171 |
| Guamanians/Chamorros | 60.5 /100 | #169 | Good $101,170 |
| Slovaks | 58.8 /100 | #170 | Average $101,029 |
| South Americans | 56.4 /100 | #171 | Average $100,837 |
| Immigrants | Uzbekistan | 52.5 /100 | #172 | Average $100,523 |