Immigrants from Bangladesh vs Vietnamese Median Female Earnings
COMPARE
Immigrants from Bangladesh
Vietnamese
Median Female Earnings
Median Female Earnings Comparison
Immigrants from Bangladesh
Vietnamese
$39,910
MEDIAN FEMALE EARNINGS
60.8/ 100
METRIC RATING
165th/ 347
METRIC RANK
$40,377
MEDIAN FEMALE EARNINGS
80.4/ 100
METRIC RATING
147th/ 347
METRIC RANK
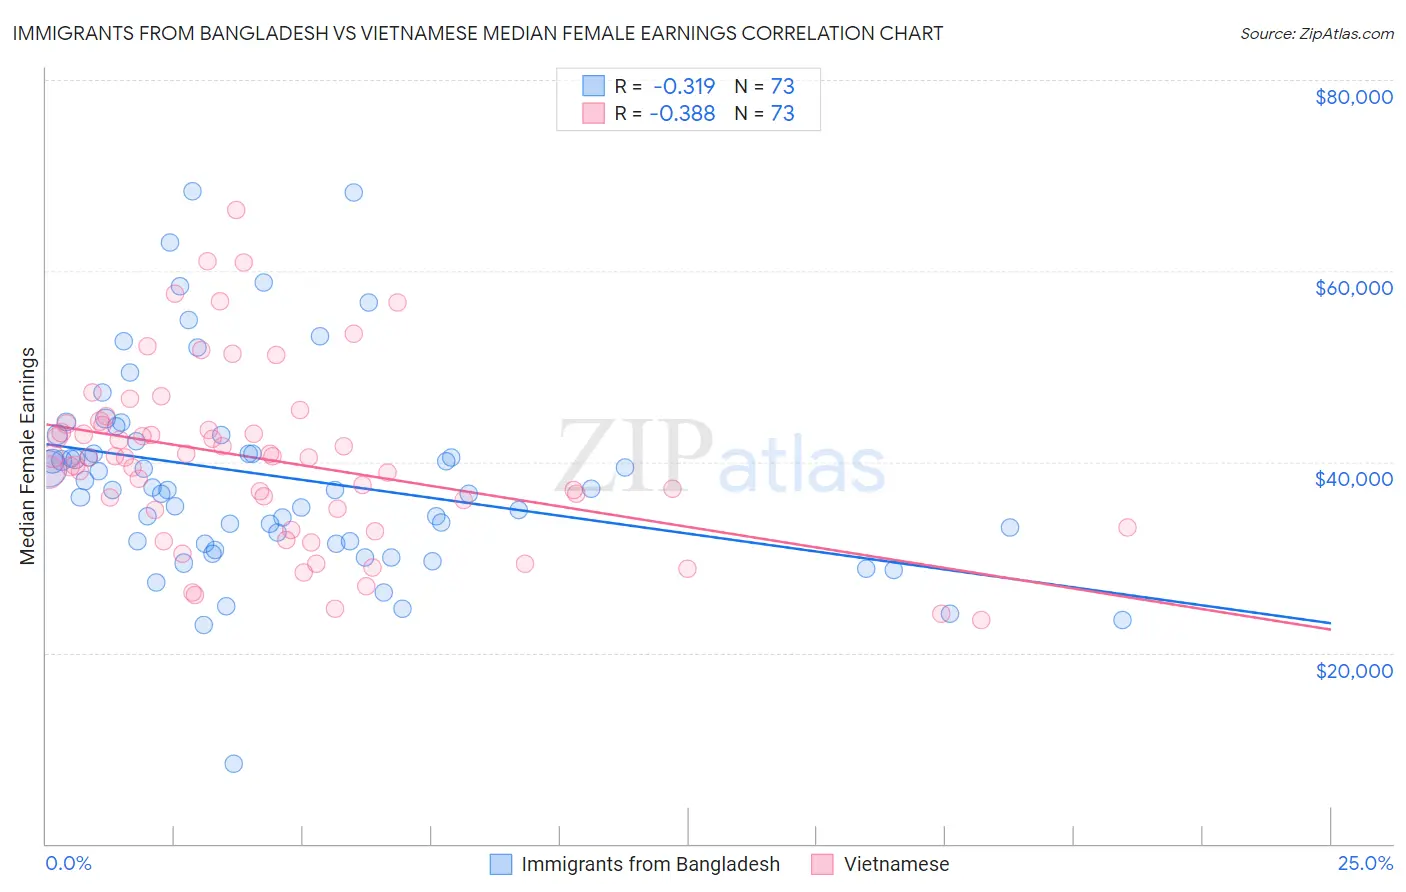
Immigrants from Bangladesh vs Vietnamese Median Female Earnings Correlation Chart
The statistical analysis conducted on geographies consisting of 203,663,307 people shows a mild negative correlation between the proportion of Immigrants from Bangladesh and median female earnings in the United States with a correlation coefficient (R) of -0.319 and weighted average of $39,910. Similarly, the statistical analysis conducted on geographies consisting of 170,738,706 people shows a mild negative correlation between the proportion of Vietnamese and median female earnings in the United States with a correlation coefficient (R) of -0.388 and weighted average of $40,377, a difference of 1.2%.
Median Female Earnings Correlation Summary
| Measurement | Immigrants from Bangladesh | Vietnamese |
| Minimum | $8,380 | $23,385 |
| Maximum | $68,327 | $66,442 |
| Range | $59,947 | $43,057 |
| Mean | $38,386 | $40,184 |
| Median | $37,048 | $40,448 |
| Interquartile 25% (IQ1) | $31,570 | $34,018 |
| Interquartile 75% (IQ3) | $42,477 | $43,912 |
| Interquartile Range (IQR) | $10,907 | $9,894 |
| Standard Deviation (Sample) | $10,596 | $9,135 |
| Standard Deviation (Population) | $10,523 | $9,072 |
Demographics Similar to Immigrants from Bangladesh and Vietnamese by Median Female Earnings
In terms of median female earnings, the demographic groups most similar to Immigrants from Bangladesh are Immigrants from Ghana ($39,894, a difference of 0.040%), Immigrants from Saudi Arabia ($39,952, a difference of 0.11%), Lebanese ($40,006, a difference of 0.24%), South American Indian ($40,019, a difference of 0.27%), and Alsatian ($40,060, a difference of 0.38%). Similarly, the demographic groups most similar to Vietnamese are Polish ($40,371, a difference of 0.020%), Immigrants from Cameroon ($40,354, a difference of 0.060%), Immigrants from Chile ($40,353, a difference of 0.060%), Immigrants from Armenia ($40,340, a difference of 0.090%), and Ghanaian ($40,429, a difference of 0.13%).
| Demographics | Rating | Rank | Median Female Earnings |
| Ghanaians | 82.1 /100 | #146 | Excellent $40,429 |
| Vietnamese | 80.4 /100 | #147 | Excellent $40,377 |
| Poles | 80.2 /100 | #148 | Excellent $40,371 |
| Immigrants | Cameroon | 79.7 /100 | #149 | Good $40,354 |
| Immigrants | Chile | 79.6 /100 | #150 | Good $40,353 |
| Immigrants | Armenia | 79.2 /100 | #151 | Good $40,340 |
| West Indians | 78.4 /100 | #152 | Good $40,317 |
| British West Indians | 77.7 /100 | #153 | Good $40,299 |
| Immigrants | Oceania | 77.6 /100 | #154 | Good $40,297 |
| Immigrants | Africa | 76.2 /100 | #155 | Good $40,257 |
| Peruvians | 75.3 /100 | #156 | Good $40,234 |
| Portuguese | 73.0 /100 | #157 | Good $40,177 |
| Immigrants | Senegal | 72.2 /100 | #158 | Good $40,157 |
| Immigrants | Vietnam | 72.0 /100 | #159 | Good $40,153 |
| Inupiat | 68.9 /100 | #160 | Good $40,080 |
| Alsatians | 68.0 /100 | #161 | Good $40,060 |
| South American Indians | 66.1 /100 | #162 | Good $40,019 |
| Lebanese | 65.5 /100 | #163 | Good $40,006 |
| Immigrants | Saudi Arabia | 62.9 /100 | #164 | Good $39,952 |
| Immigrants | Bangladesh | 60.8 /100 | #165 | Good $39,910 |
| Immigrants | Ghana | 60.0 /100 | #166 | Good $39,894 |