Spanish American vs Navajo Median Household Income
COMPARE
Spanish American
Navajo
Median Household Income
Median Household Income Comparison
Spanish Americans
Navajo
$75,386
MEDIAN HOUSEHOLD INCOME
0.2/ 100
METRIC RATING
277th/ 347
METRIC RANK
$59,159
MEDIAN HOUSEHOLD INCOME
0.0/ 100
METRIC RATING
346th/ 347
METRIC RANK
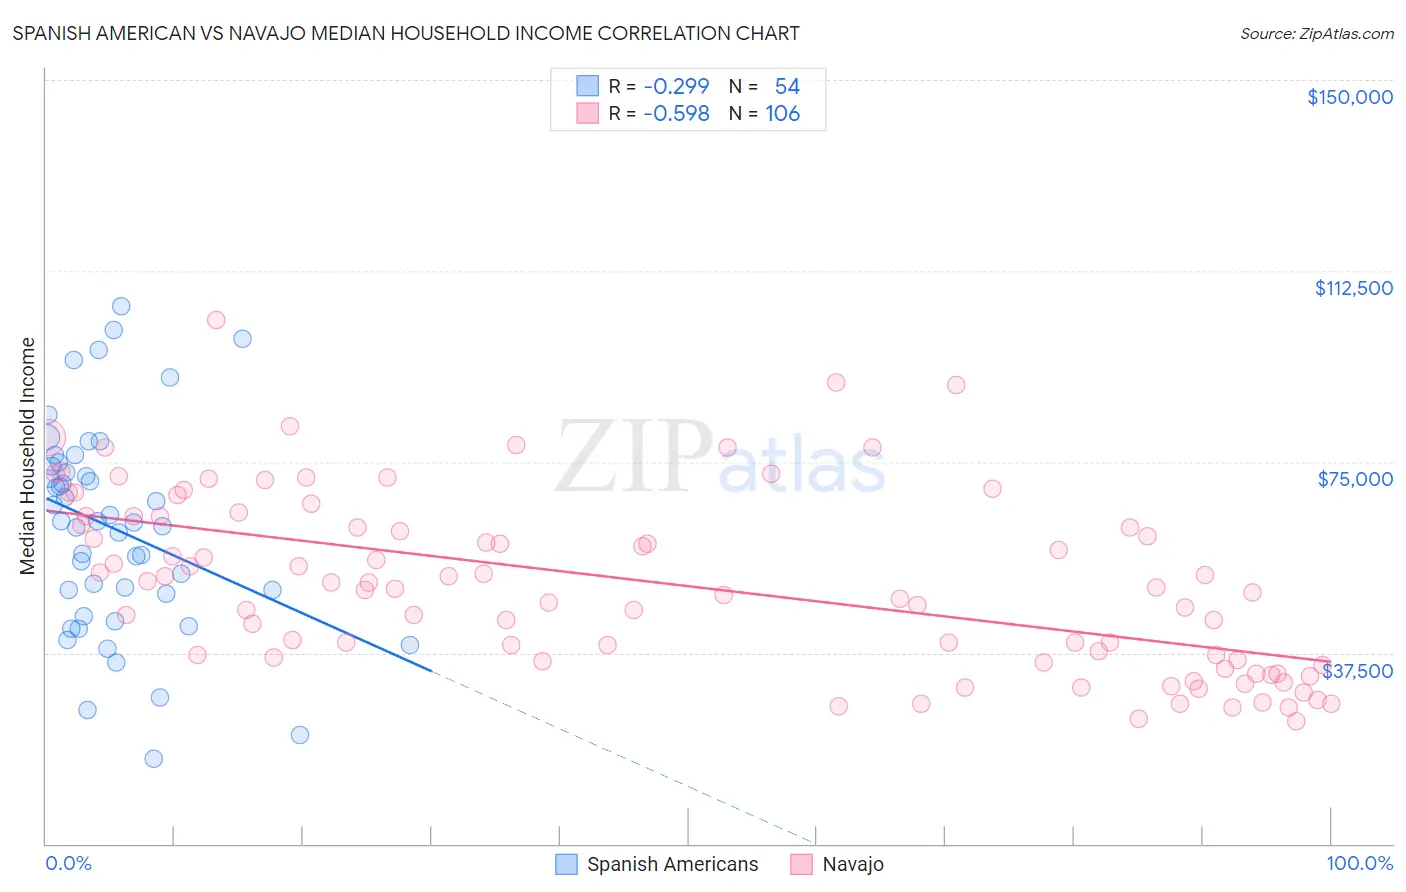
Spanish American vs Navajo Median Household Income Correlation Chart
The statistical analysis conducted on geographies consisting of 103,163,457 people shows a weak negative correlation between the proportion of Spanish Americans and median household income in the United States with a correlation coefficient (R) of -0.299 and weighted average of $75,386. Similarly, the statistical analysis conducted on geographies consisting of 224,715,573 people shows a substantial negative correlation between the proportion of Navajo and median household income in the United States with a correlation coefficient (R) of -0.598 and weighted average of $59,159, a difference of 27.4%.
Median Household Income Correlation Summary
| Measurement | Spanish American | Navajo |
| Minimum | $16,806 | $24,004 |
| Maximum | $105,648 | $102,885 |
| Range | $88,842 | $78,881 |
| Mean | $61,918 | $51,106 |
| Median | $63,227 | $50,167 |
| Interquartile 25% (IQ1) | $49,158 | $36,185 |
| Interquartile 75% (IQ3) | $74,166 | $64,286 |
| Interquartile Range (IQR) | $25,008 | $28,101 |
| Standard Deviation (Sample) | $20,311 | $17,310 |
| Standard Deviation (Population) | $20,122 | $17,228 |
Similar Demographics by Median Household Income
Demographics Similar to Spanish Americans by Median Household Income
In terms of median household income, the demographic groups most similar to Spanish Americans are Immigrants from Latin America ($75,420, a difference of 0.040%), Osage ($75,240, a difference of 0.19%), Immigrants from Micronesia ($75,574, a difference of 0.25%), British West Indian ($75,647, a difference of 0.35%), and Immigrants from Guatemala ($75,123, a difference of 0.35%).
| Demographics | Rating | Rank | Median Household Income |
| Hmong | 0.3 /100 | #270 | Tragic $75,839 |
| Pennsylvania Germans | 0.3 /100 | #271 | Tragic $75,814 |
| Somalis | 0.3 /100 | #272 | Tragic $75,782 |
| Liberians | 0.2 /100 | #273 | Tragic $75,667 |
| British West Indians | 0.2 /100 | #274 | Tragic $75,647 |
| Immigrants | Micronesia | 0.2 /100 | #275 | Tragic $75,574 |
| Immigrants | Latin America | 0.2 /100 | #276 | Tragic $75,420 |
| Spanish Americans | 0.2 /100 | #277 | Tragic $75,386 |
| Osage | 0.2 /100 | #278 | Tragic $75,240 |
| Immigrants | Guatemala | 0.2 /100 | #279 | Tragic $75,123 |
| Senegalese | 0.2 /100 | #280 | Tragic $74,999 |
| Immigrants | Liberia | 0.1 /100 | #281 | Tragic $74,896 |
| Central American Indians | 0.1 /100 | #282 | Tragic $74,847 |
| Cree | 0.1 /100 | #283 | Tragic $74,685 |
| Yaqui | 0.1 /100 | #284 | Tragic $74,596 |
Demographics Similar to Navajo by Median Household Income
In terms of median household income, the demographic groups most similar to Navajo are Puerto Rican ($59,197, a difference of 0.060%), Tohono O'odham ($61,663, a difference of 4.2%), Houma ($62,575, a difference of 5.8%), Pima ($63,262, a difference of 6.9%), and Crow ($63,681, a difference of 7.6%).
| Demographics | Rating | Rank | Median Household Income |
| Creek | 0.0 /100 | #333 | Tragic $67,715 |
| Blacks/African Americans | 0.0 /100 | #334 | Tragic $67,573 |
| Cheyenne | 0.0 /100 | #335 | Tragic $66,974 |
| Immigrants | Congo | 0.0 /100 | #336 | Tragic $66,768 |
| Kiowa | 0.0 /100 | #337 | Tragic $65,914 |
| Immigrants | Yemen | 0.0 /100 | #338 | Tragic $65,194 |
| Hopi | 0.0 /100 | #339 | Tragic $65,043 |
| Pueblo | 0.0 /100 | #340 | Tragic $64,692 |
| Crow | 0.0 /100 | #341 | Tragic $63,681 |
| Pima | 0.0 /100 | #342 | Tragic $63,262 |
| Houma | 0.0 /100 | #343 | Tragic $62,575 |
| Tohono O'odham | 0.0 /100 | #344 | Tragic $61,663 |
| Puerto Ricans | 0.0 /100 | #345 | Tragic $59,197 |
| Navajo | 0.0 /100 | #346 | Tragic $59,159 |
| Lumbee | 0.0 /100 | #347 | Tragic $54,644 |