Immigrants from Austria vs Immigrants from Syria Householder Income Under 25 years
COMPARE
Immigrants from Austria
Immigrants from Syria
Householder Income Under 25 years
Householder Income Under 25 years Comparison
Immigrants from Austria
Immigrants from Syria
$52,400
HOUSEHOLDER INCOME UNDER 25 YEARS
62.6/ 100
METRIC RATING
166th/ 347
METRIC RANK
$51,494
HOUSEHOLDER INCOME UNDER 25 YEARS
15.4/ 100
METRIC RATING
198th/ 347
METRIC RANK
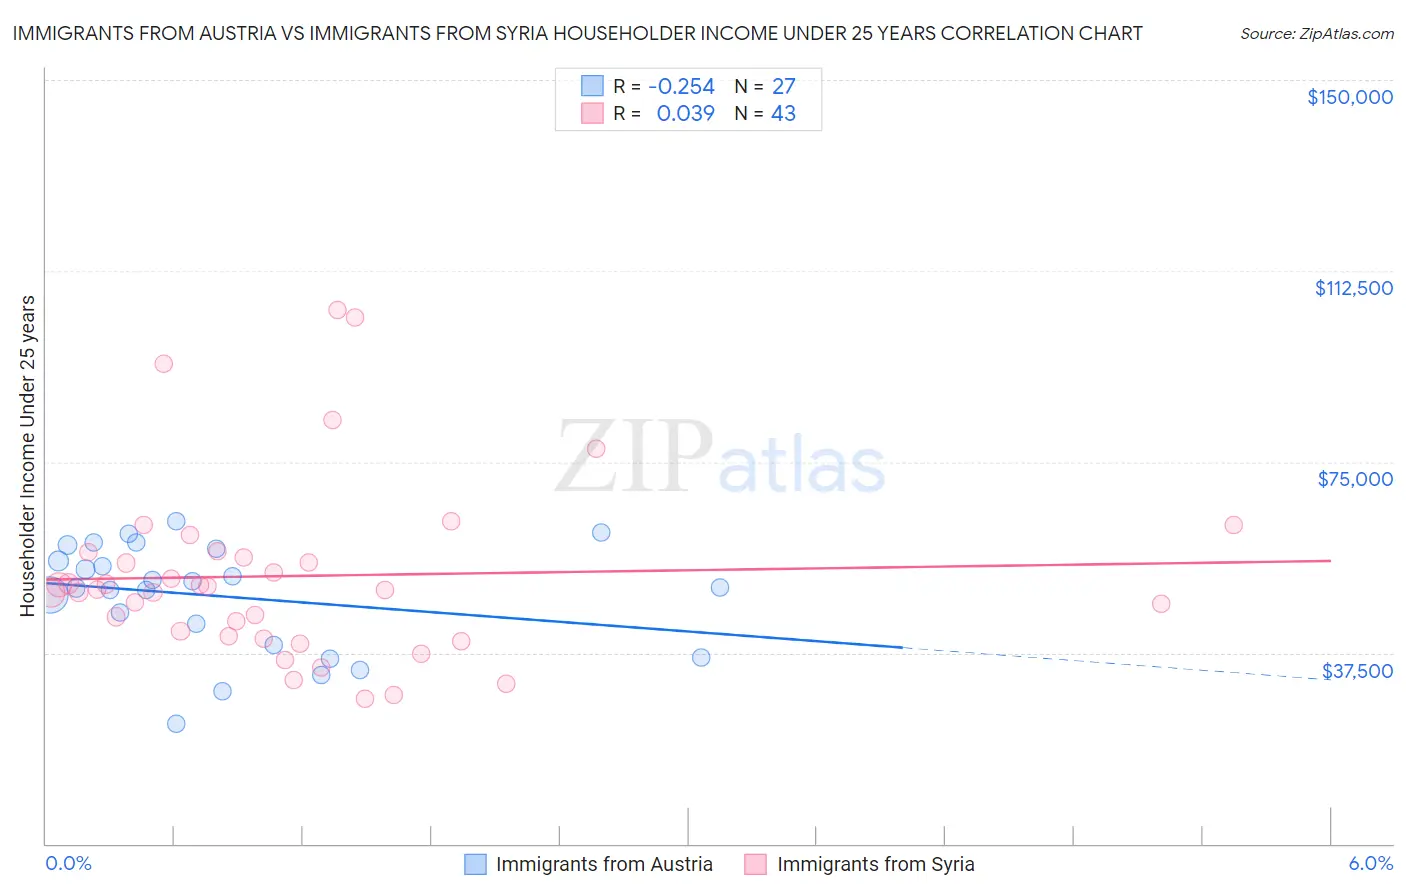
Immigrants from Austria vs Immigrants from Syria Householder Income Under 25 years Correlation Chart
The statistical analysis conducted on geographies consisting of 148,326,124 people shows a weak negative correlation between the proportion of Immigrants from Austria and household income with householder under the age of 25 in the United States with a correlation coefficient (R) of -0.254 and weighted average of $52,400. Similarly, the statistical analysis conducted on geographies consisting of 157,076,091 people shows no correlation between the proportion of Immigrants from Syria and household income with householder under the age of 25 in the United States with a correlation coefficient (R) of 0.039 and weighted average of $51,494, a difference of 1.8%.
Householder Income Under 25 years Correlation Summary
| Measurement | Immigrants from Austria | Immigrants from Syria |
| Minimum | $23,462 | $28,595 |
| Maximum | $63,282 | $104,896 |
| Range | $39,820 | $76,300 |
| Mean | $48,547 | $52,580 |
| Median | $50,350 | $49,883 |
| Interquartile 25% (IQ1) | $39,087 | $40,651 |
| Interquartile 75% (IQ3) | $57,875 | $57,278 |
| Interquartile Range (IQR) | $18,788 | $16,628 |
| Standard Deviation (Sample) | $10,655 | $17,565 |
| Standard Deviation (Population) | $10,456 | $17,359 |
Similar Demographics by Householder Income Under 25 years
Demographics Similar to Immigrants from Austria by Householder Income Under 25 years
In terms of householder income under 25 years, the demographic groups most similar to Immigrants from Austria are Polish ($52,407, a difference of 0.010%), Immigrants from Uganda ($52,374, a difference of 0.050%), Immigrants from Trinidad and Tobago ($52,437, a difference of 0.070%), Japanese ($52,365, a difference of 0.070%), and Immigrants from Chile ($52,440, a difference of 0.080%).
| Demographics | Rating | Rank | Householder Income Under 25 years |
| Mongolians | 70.2 /100 | #159 | Good $52,540 |
| Immigrants | Turkey | 68.3 /100 | #160 | Good $52,503 |
| Uruguayans | 66.2 /100 | #161 | Good $52,465 |
| Immigrants | Cambodia | 65.4 /100 | #162 | Good $52,450 |
| Immigrants | Chile | 64.8 /100 | #163 | Good $52,440 |
| Immigrants | Trinidad and Tobago | 64.7 /100 | #164 | Good $52,437 |
| Poles | 63.0 /100 | #165 | Good $52,407 |
| Immigrants | Austria | 62.6 /100 | #166 | Good $52,400 |
| Immigrants | Uganda | 61.1 /100 | #167 | Good $52,374 |
| Japanese | 60.5 /100 | #168 | Good $52,365 |
| Canadians | 58.8 /100 | #169 | Average $52,336 |
| Israelis | 58.8 /100 | #170 | Average $52,335 |
| Immigrants | Uruguay | 56.8 /100 | #171 | Average $52,302 |
| Cypriots | 51.2 /100 | #172 | Average $52,209 |
| Barbadians | 50.8 /100 | #173 | Average $52,202 |
Demographics Similar to Immigrants from Syria by Householder Income Under 25 years
In terms of householder income under 25 years, the demographic groups most similar to Immigrants from Syria are Swiss ($51,493, a difference of 0.0%), Pima ($51,503, a difference of 0.020%), Immigrants from West Indies ($51,479, a difference of 0.030%), British ($51,477, a difference of 0.030%), and Palestinian ($51,515, a difference of 0.040%).
| Demographics | Rating | Rank | Householder Income Under 25 years |
| Panamanians | 19.5 /100 | #191 | Poor $51,611 |
| West Indians | 18.5 /100 | #192 | Poor $51,583 |
| Immigrants | Eritrea | 18.1 /100 | #193 | Poor $51,574 |
| Guatemalans | 16.4 /100 | #194 | Poor $51,525 |
| Estonians | 16.4 /100 | #195 | Poor $51,523 |
| Palestinians | 16.1 /100 | #196 | Poor $51,515 |
| Pima | 15.7 /100 | #197 | Poor $51,503 |
| Immigrants | Syria | 15.4 /100 | #198 | Poor $51,494 |
| Swiss | 15.4 /100 | #199 | Poor $51,493 |
| Immigrants | West Indies | 14.9 /100 | #200 | Poor $51,479 |
| British | 14.9 /100 | #201 | Poor $51,477 |
| Immigrants | Guatemala | 14.0 /100 | #202 | Poor $51,447 |
| Immigrants | Cameroon | 13.6 /100 | #203 | Poor $51,433 |
| Czechs | 13.2 /100 | #204 | Poor $51,421 |
| Cape Verdeans | 12.3 /100 | #205 | Poor $51,387 |