Cuban vs Immigrants from Somalia Householder Income Ages 45 - 64 years
COMPARE
Cuban
Immigrants from Somalia
Householder Income Ages 45 - 64 years
Householder Income Ages 45 - 64 years Comparison
Cubans
Immigrants from Somalia
$86,301
HOUSEHOLDER INCOME AGES 45 - 64 YEARS
0.1/ 100
METRIC RATING
289th/ 347
METRIC RANK
$86,987
HOUSEHOLDER INCOME AGES 45 - 64 YEARS
0.1/ 100
METRIC RATING
280th/ 347
METRIC RANK
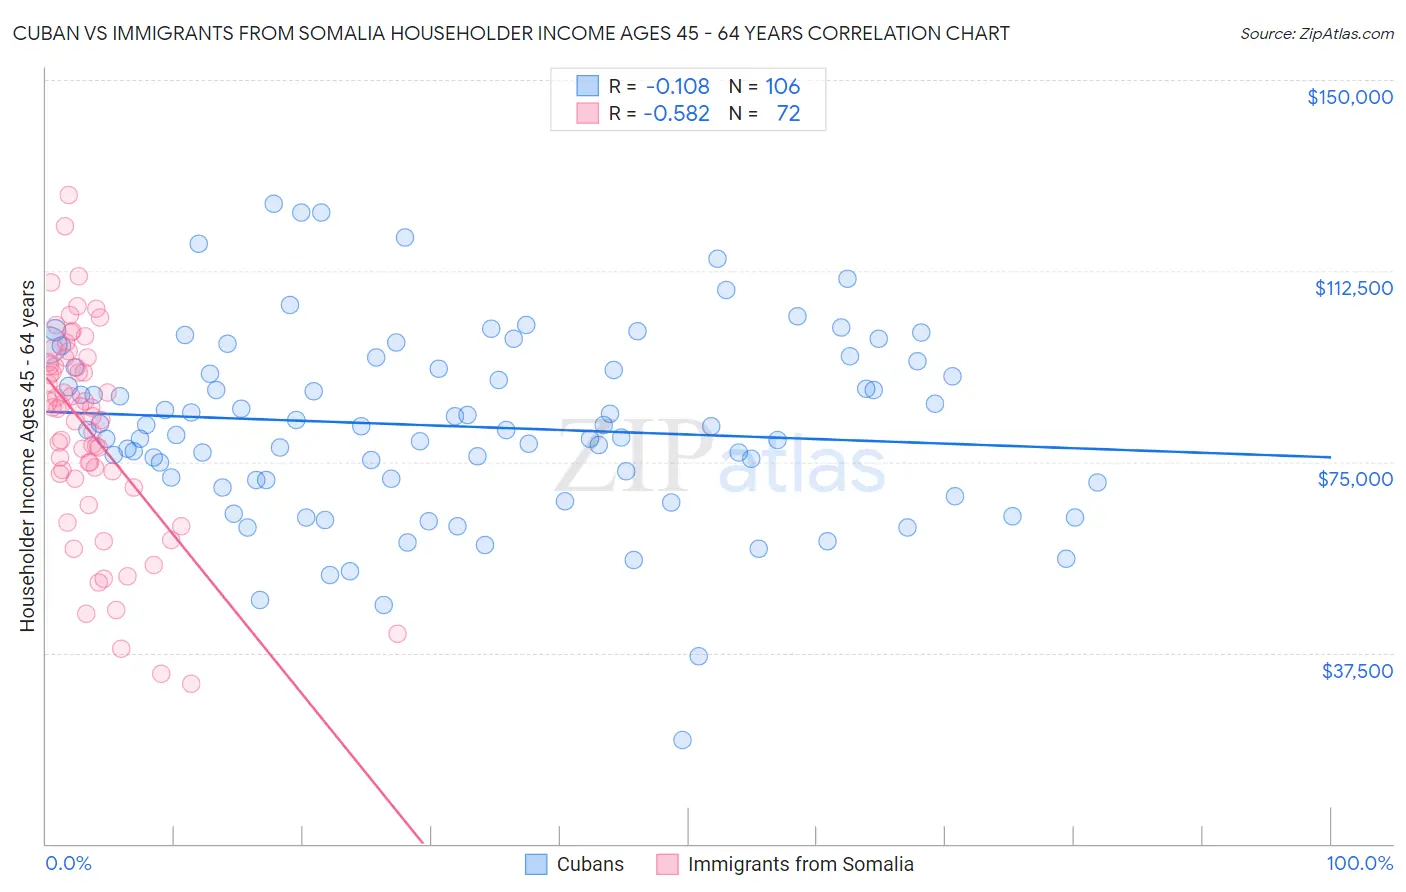
Cuban vs Immigrants from Somalia Householder Income Ages 45 - 64 years Correlation Chart
The statistical analysis conducted on geographies consisting of 448,142,263 people shows a poor negative correlation between the proportion of Cubans and household income with householder between the ages 45 and 64 in the United States with a correlation coefficient (R) of -0.108 and weighted average of $86,301. Similarly, the statistical analysis conducted on geographies consisting of 92,059,302 people shows a substantial negative correlation between the proportion of Immigrants from Somalia and household income with householder between the ages 45 and 64 in the United States with a correlation coefficient (R) of -0.582 and weighted average of $86,987, a difference of 0.80%.
Householder Income Ages 45 - 64 years Correlation Summary
| Measurement | Cuban | Immigrants from Somalia |
| Minimum | $20,329 | $31,458 |
| Maximum | $125,619 | $127,433 |
| Range | $105,290 | $95,975 |
| Mean | $81,965 | $81,140 |
| Median | $81,610 | $85,605 |
| Interquartile 25% (IQ1) | $71,341 | $72,230 |
| Interquartile 75% (IQ3) | $93,648 | $94,234 |
| Interquartile Range (IQR) | $22,307 | $22,004 |
| Standard Deviation (Sample) | $18,497 | $20,209 |
| Standard Deviation (Population) | $18,410 | $20,068 |
Demographics Similar to Cubans and Immigrants from Somalia by Householder Income Ages 45 - 64 years
In terms of householder income ages 45 - 64 years, the demographic groups most similar to Cubans are Immigrants from St. Vincent and the Grenadines ($86,394, a difference of 0.11%), Bangladeshi ($86,402, a difference of 0.12%), Cherokee ($86,125, a difference of 0.20%), Immigrants from Guatemala ($86,573, a difference of 0.32%), and Blackfeet ($86,595, a difference of 0.34%). Similarly, the demographic groups most similar to Immigrants from Somalia are Yakama ($86,992, a difference of 0.010%), Immigrants from Jamaica ($87,035, a difference of 0.050%), Yaqui ($86,914, a difference of 0.080%), Senegalese ($86,897, a difference of 0.10%), and Mexican ($86,816, a difference of 0.20%).
| Demographics | Rating | Rank | Householder Income Ages 45 - 64 years |
| Iroquois | 0.1 /100 | #274 | Tragic $87,255 |
| Immigrants | Belize | 0.1 /100 | #275 | Tragic $87,229 |
| Immigrants | Latin America | 0.1 /100 | #276 | Tragic $87,219 |
| Cree | 0.1 /100 | #277 | Tragic $87,185 |
| Immigrants | Jamaica | 0.1 /100 | #278 | Tragic $87,035 |
| Yakama | 0.1 /100 | #279 | Tragic $86,992 |
| Immigrants | Somalia | 0.1 /100 | #280 | Tragic $86,987 |
| Yaqui | 0.1 /100 | #281 | Tragic $86,914 |
| Senegalese | 0.1 /100 | #282 | Tragic $86,897 |
| Mexicans | 0.1 /100 | #283 | Tragic $86,816 |
| Central American Indians | 0.1 /100 | #284 | Tragic $86,764 |
| Blackfeet | 0.1 /100 | #285 | Tragic $86,595 |
| Immigrants | Guatemala | 0.1 /100 | #286 | Tragic $86,573 |
| Bangladeshis | 0.1 /100 | #287 | Tragic $86,402 |
| Immigrants | St. Vincent and the Grenadines | 0.1 /100 | #288 | Tragic $86,394 |
| Cubans | 0.1 /100 | #289 | Tragic $86,301 |
| Cherokee | 0.1 /100 | #290 | Tragic $86,125 |
| Hispanics or Latinos | 0.1 /100 | #291 | Tragic $86,006 |
| Immigrants | Central America | 0.1 /100 | #292 | Tragic $85,965 |
| Comanche | 0.1 /100 | #293 | Tragic $85,787 |
| British West Indians | 0.1 /100 | #294 | Tragic $85,571 |