Asian vs Seminole Householder Income Ages 25 - 44 years
COMPARE
Asian
Seminole
Householder Income Ages 25 - 44 years
Householder Income Ages 25 - 44 years Comparison
Asians
Seminole
$112,666
HOUSEHOLDER INCOME AGES 25 - 44 YEARS
100.0/ 100
METRIC RATING
21st/ 347
METRIC RANK
$76,584
HOUSEHOLDER INCOME AGES 25 - 44 YEARS
0.0/ 100
METRIC RATING
329th/ 347
METRIC RANK
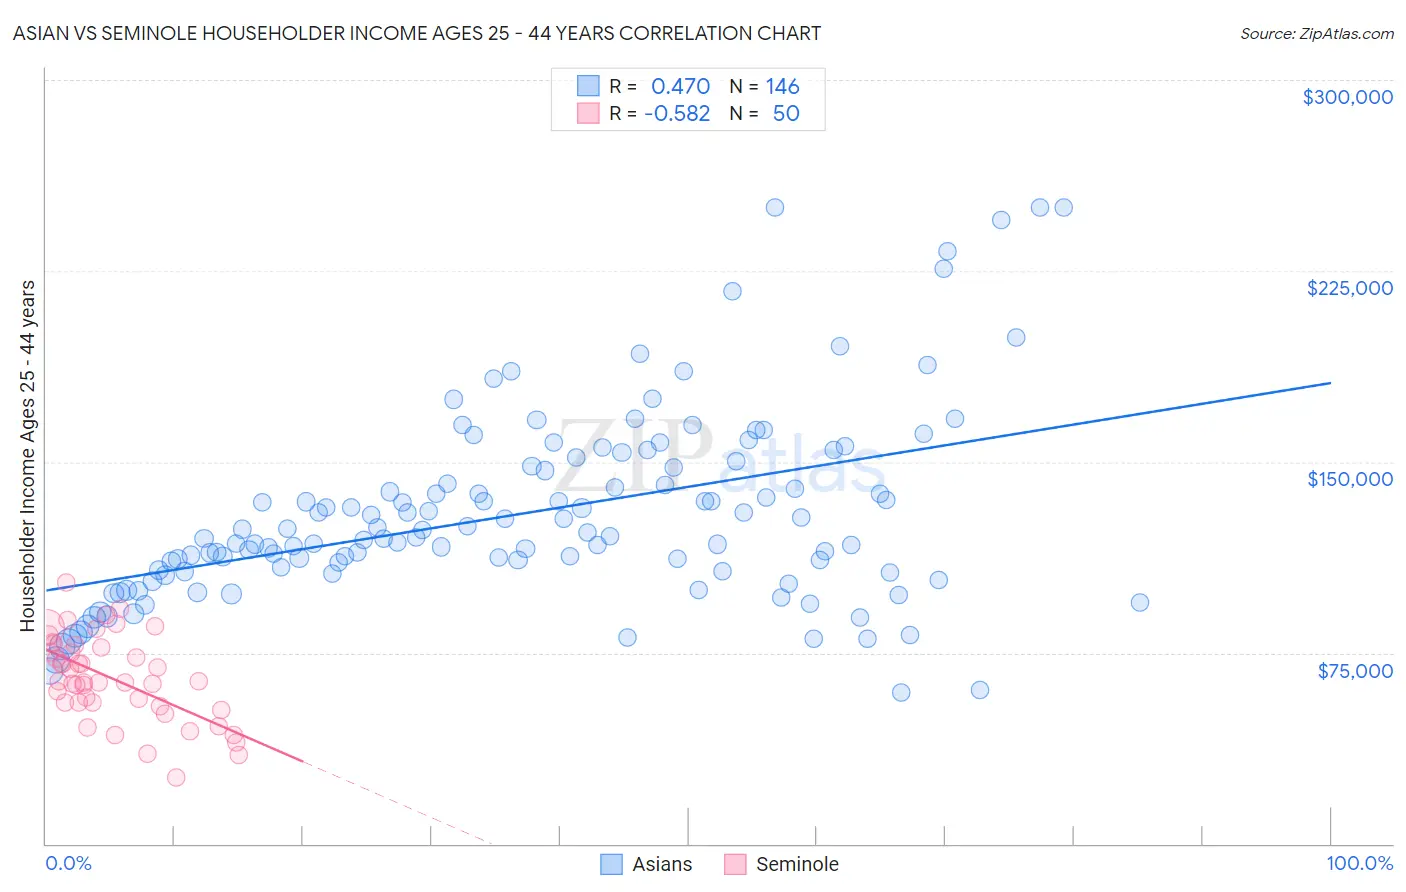
Asian vs Seminole Householder Income Ages 25 - 44 years Correlation Chart
The statistical analysis conducted on geographies consisting of 547,125,697 people shows a moderate positive correlation between the proportion of Asians and household income with householder between the ages 25 and 44 in the United States with a correlation coefficient (R) of 0.470 and weighted average of $112,666. Similarly, the statistical analysis conducted on geographies consisting of 118,219,857 people shows a substantial negative correlation between the proportion of Seminole and household income with householder between the ages 25 and 44 in the United States with a correlation coefficient (R) of -0.582 and weighted average of $76,584, a difference of 47.1%.
Householder Income Ages 25 - 44 years Correlation Summary
| Measurement | Asian | Seminole |
| Minimum | $59,230 | $26,250 |
| Maximum | $250,001 | $102,754 |
| Range | $190,771 | $76,504 |
| Mean | $129,468 | $65,024 |
| Median | $120,546 | $63,631 |
| Interquartile 25% (IQ1) | $106,801 | $55,292 |
| Interquartile 75% (IQ3) | $147,804 | $76,875 |
| Interquartile Range (IQR) | $41,004 | $21,583 |
| Standard Deviation (Sample) | $37,581 | $16,561 |
| Standard Deviation (Population) | $37,452 | $16,395 |
Similar Demographics by Householder Income Ages 25 - 44 years
Demographics Similar to Asians by Householder Income Ages 25 - 44 years
In terms of householder income ages 25 - 44 years, the demographic groups most similar to Asians are Immigrants from Belgium ($112,575, a difference of 0.080%), Immigrants from Japan ($112,228, a difference of 0.39%), Immigrants from Sweden ($112,010, a difference of 0.59%), Immigrants from Korea ($113,401, a difference of 0.65%), and Immigrants from Northern Europe ($111,676, a difference of 0.89%).
| Demographics | Rating | Rank | Householder Income Ages 25 - 44 years |
| Immigrants | Israel | 100.0 /100 | #14 | Exceptional $117,219 |
| Immigrants | South Central Asia | 100.0 /100 | #15 | Exceptional $116,626 |
| Cypriots | 100.0 /100 | #16 | Exceptional $116,364 |
| Immigrants | Australia | 100.0 /100 | #17 | Exceptional $115,947 |
| Eastern Europeans | 100.0 /100 | #18 | Exceptional $114,523 |
| Burmese | 100.0 /100 | #19 | Exceptional $113,701 |
| Immigrants | Korea | 100.0 /100 | #20 | Exceptional $113,401 |
| Asians | 100.0 /100 | #21 | Exceptional $112,666 |
| Immigrants | Belgium | 100.0 /100 | #22 | Exceptional $112,575 |
| Immigrants | Japan | 100.0 /100 | #23 | Exceptional $112,228 |
| Immigrants | Sweden | 100.0 /100 | #24 | Exceptional $112,010 |
| Immigrants | Northern Europe | 100.0 /100 | #25 | Exceptional $111,676 |
| Immigrants | Asia | 100.0 /100 | #26 | Exceptional $110,787 |
| Russians | 100.0 /100 | #27 | Exceptional $110,398 |
| Immigrants | Denmark | 100.0 /100 | #28 | Exceptional $110,363 |
Demographics Similar to Seminole by Householder Income Ages 25 - 44 years
In terms of householder income ages 25 - 44 years, the demographic groups most similar to Seminole are Immigrants from Cuba ($76,701, a difference of 0.15%), Immigrants from Bahamas ($76,910, a difference of 0.42%), Yakama ($76,226, a difference of 0.47%), Houma ($77,044, a difference of 0.60%), and Sioux ($77,089, a difference of 0.66%).
| Demographics | Rating | Rank | Householder Income Ages 25 - 44 years |
| Chickasaw | 0.0 /100 | #322 | Tragic $77,929 |
| Immigrants | Honduras | 0.0 /100 | #323 | Tragic $77,328 |
| Dutch West Indians | 0.0 /100 | #324 | Tragic $77,260 |
| Sioux | 0.0 /100 | #325 | Tragic $77,089 |
| Houma | 0.0 /100 | #326 | Tragic $77,044 |
| Immigrants | Bahamas | 0.0 /100 | #327 | Tragic $76,910 |
| Immigrants | Cuba | 0.0 /100 | #328 | Tragic $76,701 |
| Seminole | 0.0 /100 | #329 | Tragic $76,584 |
| Yakama | 0.0 /100 | #330 | Tragic $76,226 |
| Natives/Alaskans | 0.0 /100 | #331 | Tragic $75,647 |
| Bahamians | 0.0 /100 | #332 | Tragic $75,395 |
| Hopi | 0.0 /100 | #333 | Tragic $75,002 |
| Creek | 0.0 /100 | #334 | Tragic $74,847 |
| Kiowa | 0.0 /100 | #335 | Tragic $74,776 |
| Yup'ik | 0.0 /100 | #336 | Tragic $73,688 |